Equities needed the good news
November 11, 2022
Equity indices rallied hard on Thursday following the lower than anticipated CPI print. Traders went into the numbers expecting CPI around 8% YoY in October and it came out at 7.7%. Core CPI which removes food and energy came at 6.3% against expectations of 6.5%.
The market remarked immediately higher but continued to drift higher as buyers emerged throughout the session.
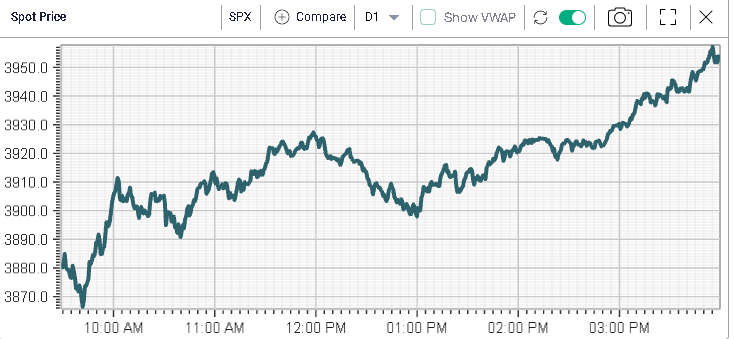
Following the numbers, multiple FED speakers started to talk about a possibility that the FED would slow down the pace of hikes, raising hopes amongst some market participants for a pivot at the December meeting. At the end of the day, the SPX finished up around 5.5%, the NDX gained 7.5%, the DJIA finished 3.7% higher, the German DAX was 3.5% higher and the French CAC settled around 2% higher.
Following those numbers, the YTD performance for the SPX is now around -18%, the NDX is around -30%, the DJIA is a mere 8% lower YTD. In Europe, the German DAX is 12% lower on the year and the French CAC is 9% lower.
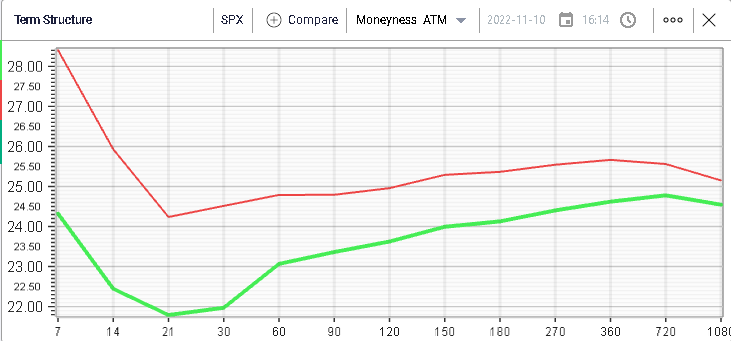
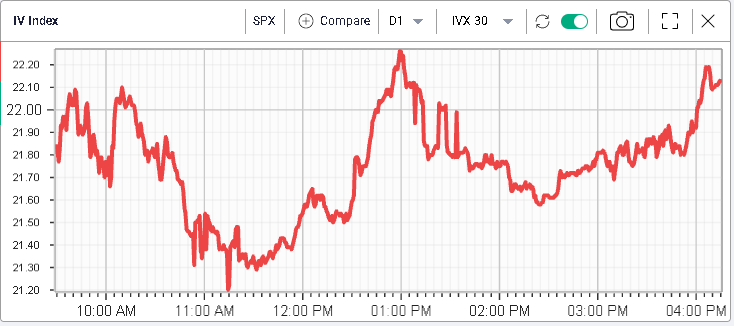
Following that strong session, US implied volatilities reset significantly lower with the 30 days IVX moving from 24.5% to 22%. This move was spread across the entire curve.
Interestingly, implied volatilities sold off in the first half of the day but started to move higher again towards the latter part for the 30d IVX on the SPX.
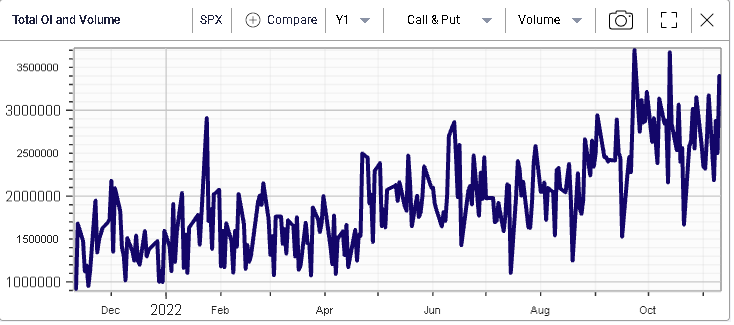
Volumes were very large with the 3rd largest volume day in the last 12 months at around 3.4 million contracts.
All sectors finished in the green yesterday with the XLE trailing up 2.2% on the day. Energy stocks have outperformed the USO over the past few months as shown on the below chart with XLE in blue and USO in yellow.

On the upside, Tech stocks were very supported and gained around 8%. The second-best performing sector was real estate with a move higher by around7.5% by time of closing.
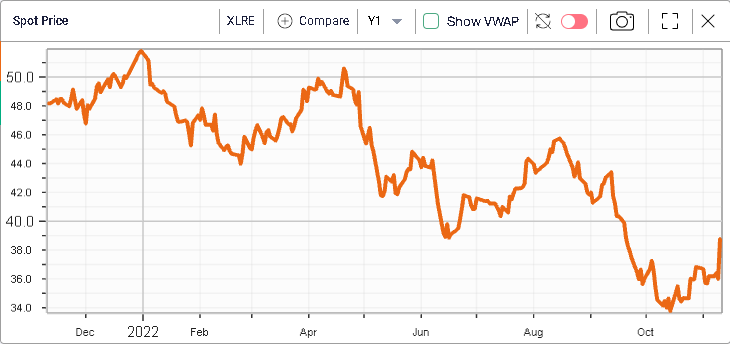
Real Estate stocks have been under pressure this year and despite yesterday’s stellar performance, they are still 25% lower YTD.
The space was supported by interest rates falling substantially following the release with the 10-year yield dropping from 4.11% before the numbers to 3.81% by close of business.
With expiration next Friday, the focus might well shift to more technical discussions over the next few sessions but the anticipations for the end of the year remain very elevated with a lot of macro releases expected and a key FOMC meeting in the middle of December.