Underperformers take the market higher
November 14, 2022
Last week was very good for Equity indices led by the more speculative parts of the markets. The NDX gained around 9%, the HSCEI was 7% higher on the week. The SPX and the German DAX gained slightly less than 6%.
We had flagged in a recent market update that the pace of the selloff for the NDX, as shown on the below downtrend for 2022 had slowed down in recent weeks.
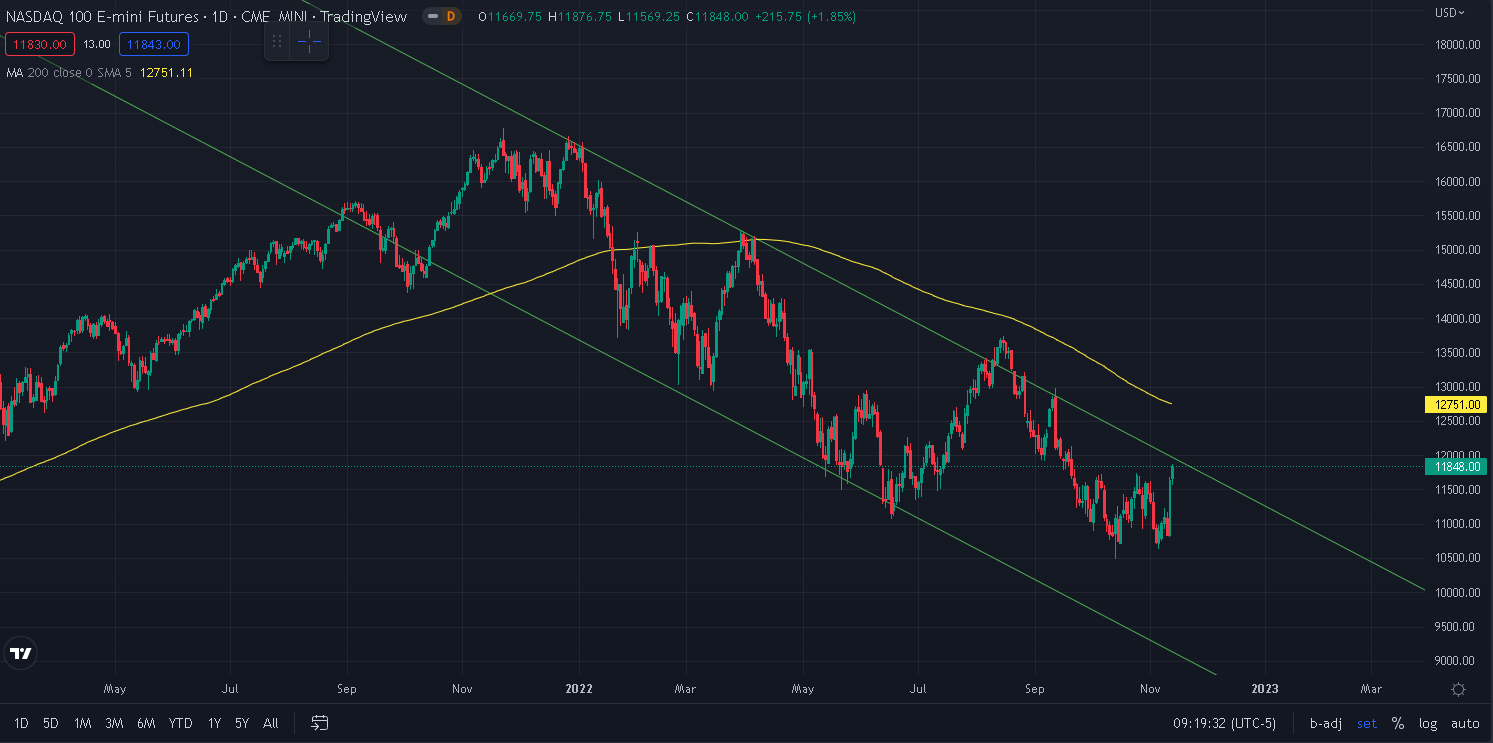
Source: Tradingview.com
The reversal has been so strong that we are now approaching the top end of the downtrend channel that has been in place for most of 2022. During the summer rally, the upper bound was slightly broken and the NQ spent about a week above it but other than that, this downtrend has been pretty useful to track.
Considering the importance for technical analysts of this area, it will be very interesting to watch how the market reacts around it should we test it in the coming days or weeks.
To give some context to last week’s reduction of market stress, we refer to the below term structure chart for the NDX displaying the change over the week from the orange line on the 4th Nov’22 to last Friday’s line in red.
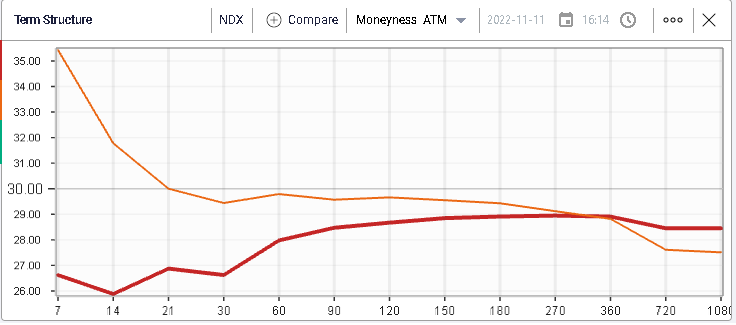
7 days implied volatility lost more than 8 points over the week and the 30 days bucket dropped almost 3 points.
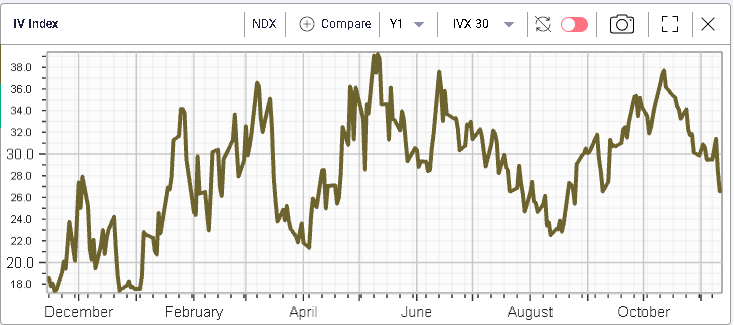
Looking at the historical 30d IVX chart, we can see that last week’s drop in volatility was meaningful and sets implied volatilities in the NDX around the middle of the last 12 month’s range.
Scanning through sectors for the past week, all 11 major divisions of the US stock market gained but with very large divergences in performance.
On the upside, Tech stocks outperformed significantly gaining more than 10%. Communications stock also performed very strongly with a weekly gain of slightly less than 10%.
As shown below, those two segments of the market have performed very poorly so far in 2022 and the fact that they are leading the bounce is quite informative.
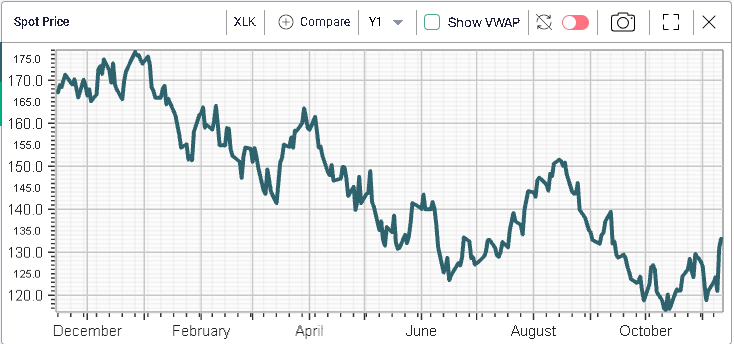
To put things in context, despite the very strong performance seen in the last few weeks, Tech stocks are still 24% lower on the year and Communications stocks have still lost 36%.
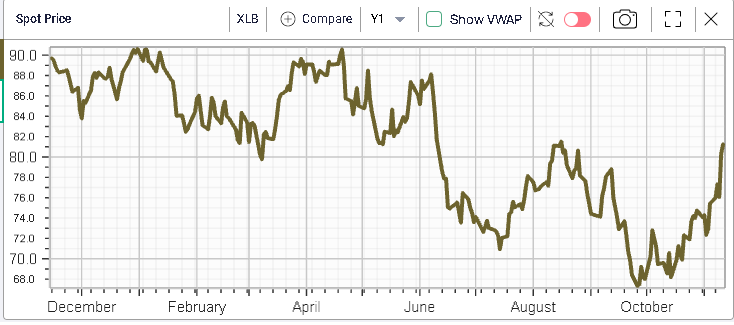
In third place last week, we find the Materials space which has not seen the same kind of underperformance as Tech and Comms. In fact, after last week, Materials are now only 9% lower on the year.
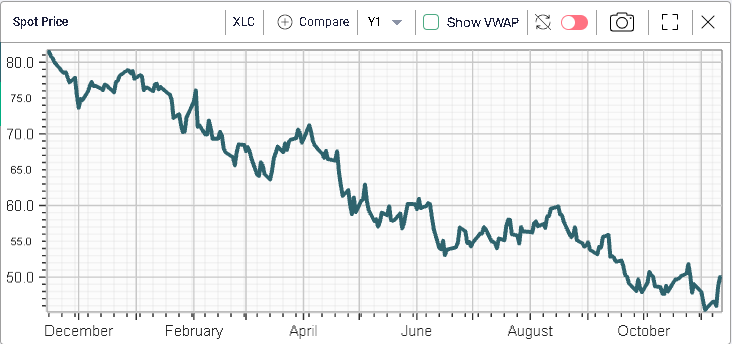
At the bottom of the performance rankings, we find Utilities, Healthcare and Energy which gained slightly less than 2% over the week. Those sectors are amongst the best performing ones in 2022 respectively -4%, -4.5% and +63% YTD.
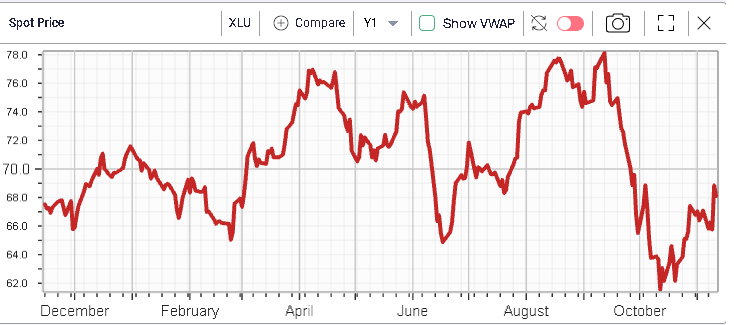
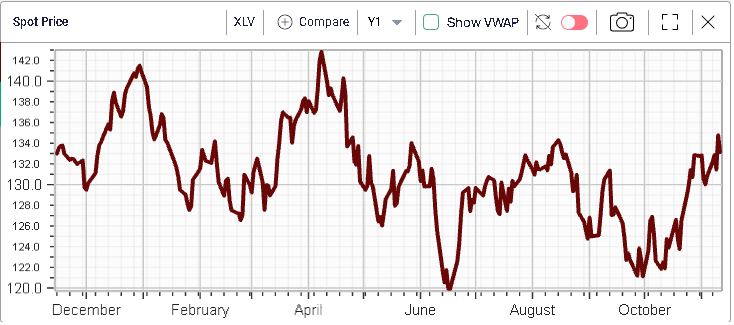
To sum-up, at the sector level, the best performing segments over the past week were those that had been mostly affected by the selloff in 2022 and the worst performing ones were those that had generally been insulated from the selling pressure.
This is an important observation and shows that last week’s rally was driven first and foremost by names that only a few weeks ago, people did not want to own and had probably underweighted in their portfolios (or at least sold out of).
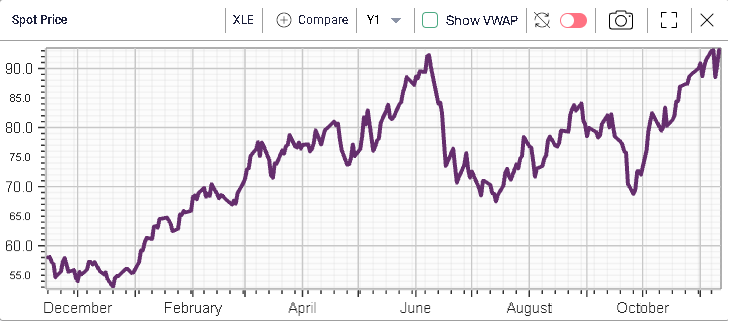
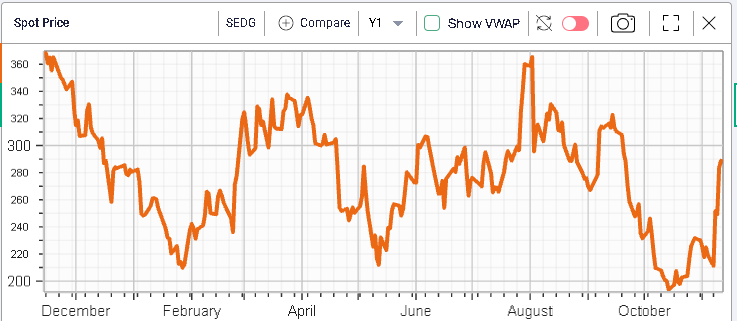
This is obviously not a 1 for 1 relationship, for instance, one of last week’s best performing names was SEDG, a company that specializes in the technology around solar energy. The stock gained more than 30% in a week and is now up around 2.3% on the year.
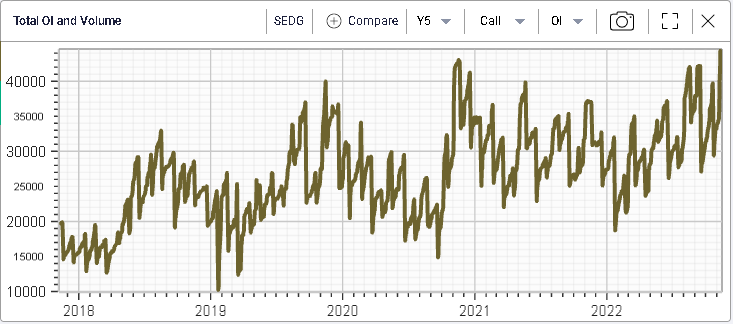
The call open interest has reached its higher level in 5 years.
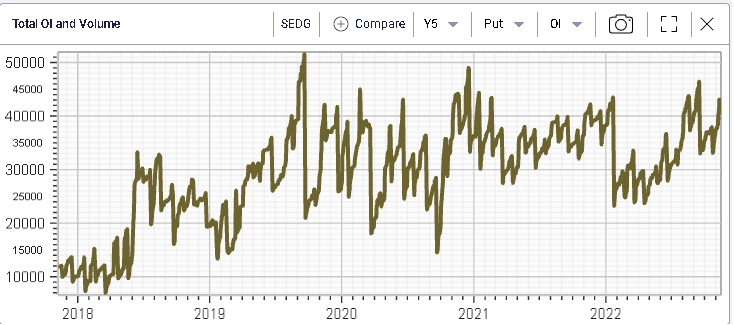
Put OI has also increased significantly in the name over the past few weeks.
Over the past two weeks, traders have had a lot of information to digest. From a FED that very clearly stated it would continue to raise interest rates until the job was done to a lower-than-expected CPI print that raised hopes of a pivot sometime soon. Next week will be lighter with only a handful of macro releases due such as the Euro-Zone GDP or US Retail Sales.