Europe perceived as safer than the US
November 21, 2022
Last week could be best described as a week of stabilization in developed markets with European and US indices drifting around without any clear direction. In Asia, the HSI continued to push higher gaining around 4% over the week.
The below chart highlights the performance since late 2021 of HSI Futures. The downtrend is clearly visible and apart from a few exceptions that channel has defined the trend for the Chinese index pretty well.
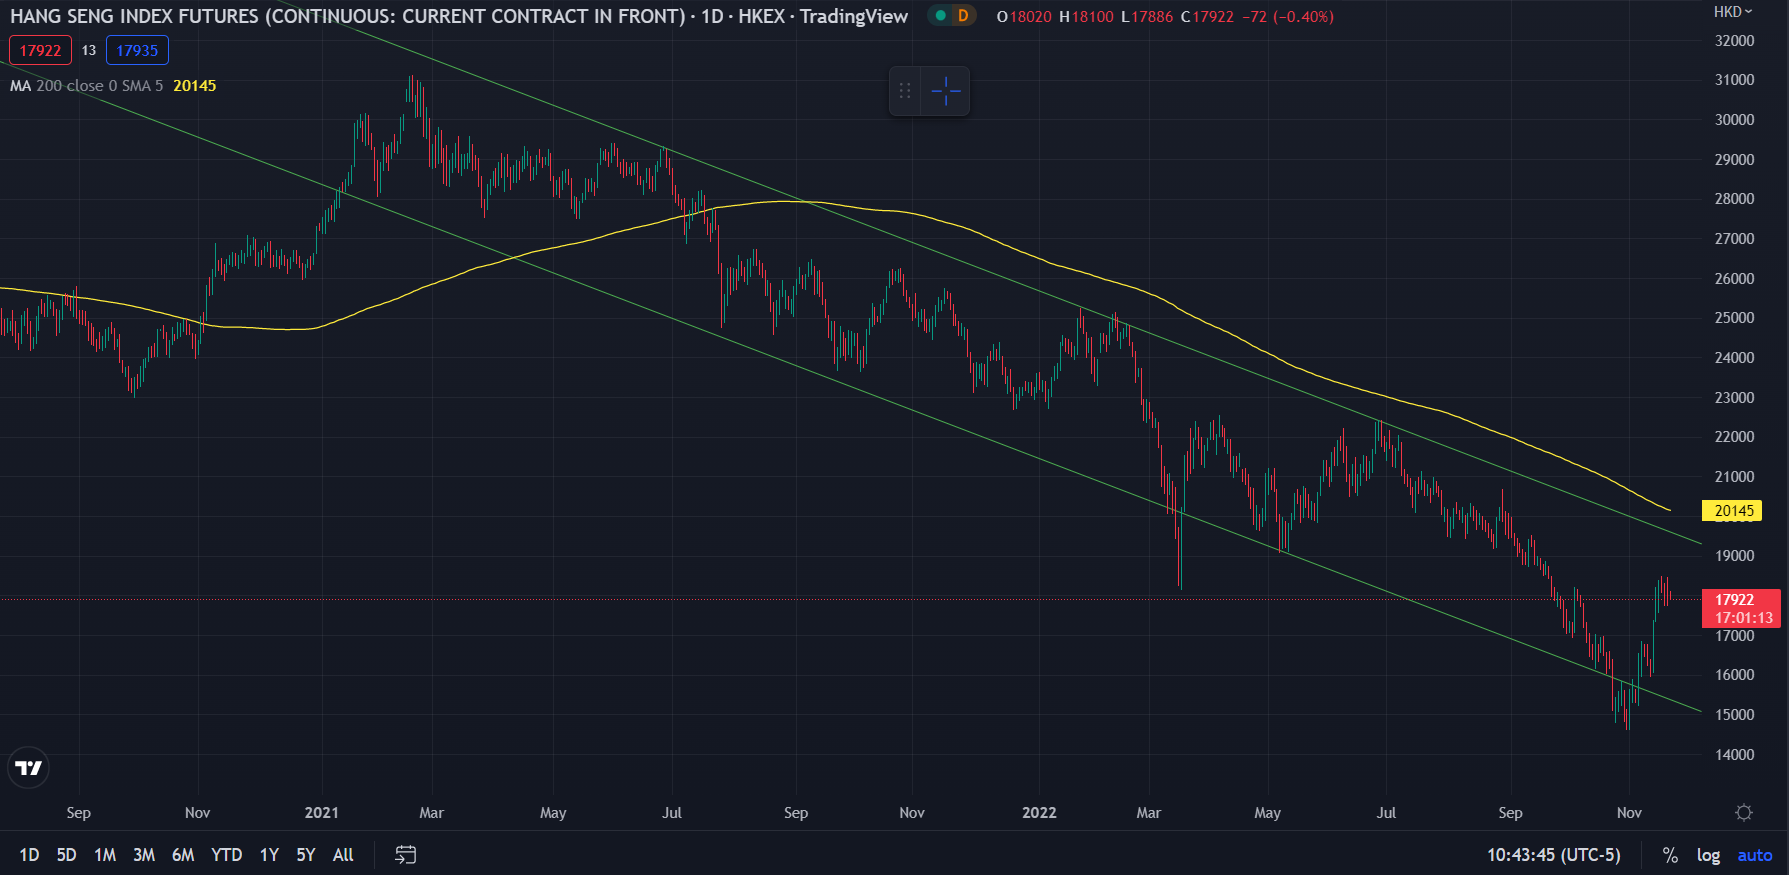
Source: Tradingview.com
European equity indices slightly outperformed their American counterparts with the German DAX settling around 1.5% higher over the week.
The breakout that was highlighted in a prior market update has played out very strongly and the German major index is now only around 8.6% lower on the year.
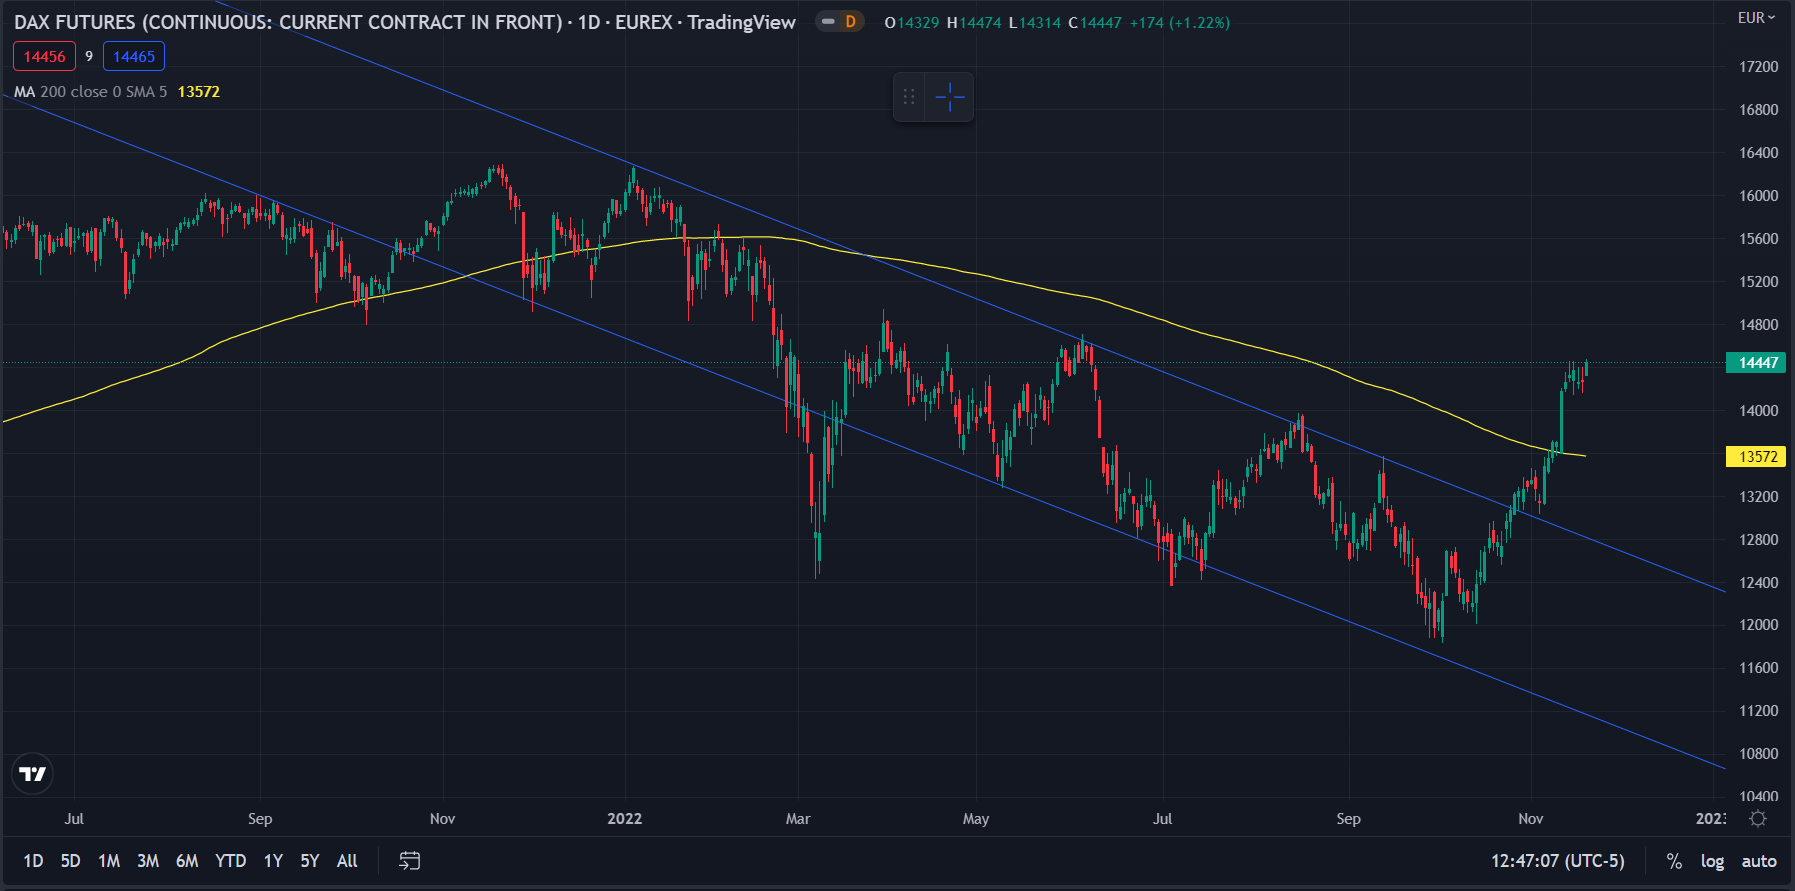
Source: Tradingview.com
In the US, the Nasdaq-100 has been testing a major resistance from the downtrend channel that has prevailed for most of 2022. We can see on the below that for now, buyers have met some resistance around that level and it will be interesting to see how things play out over the next few days/weeks.
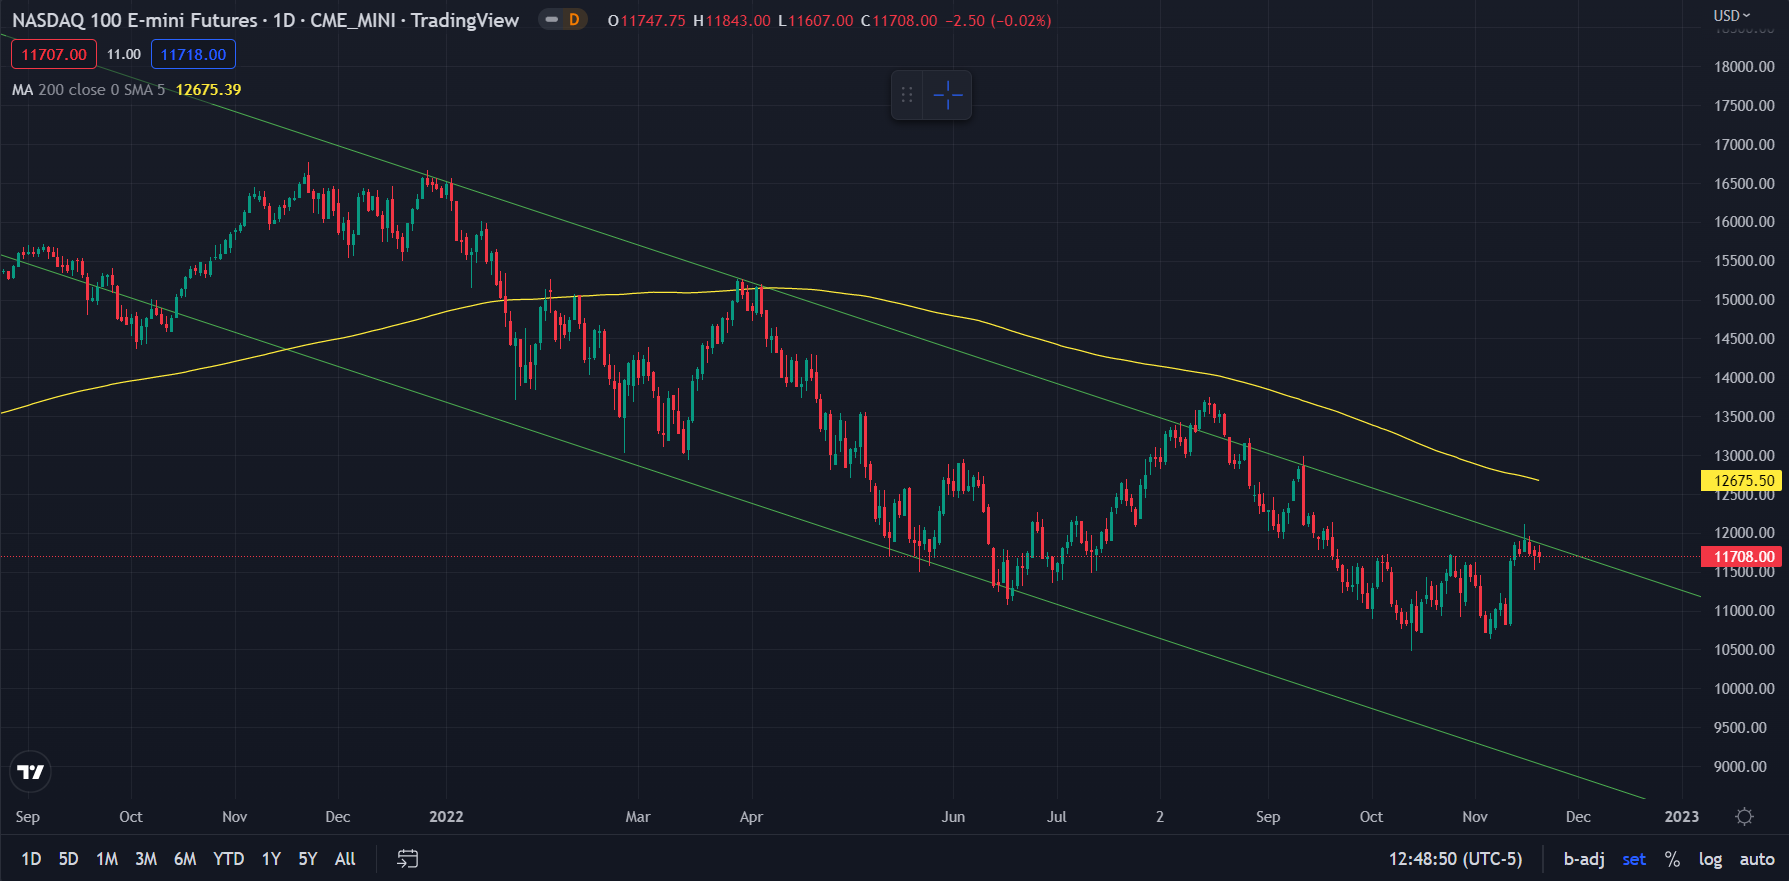
Source: Tradingview.com
Over the past month, European indices have been the strongest performers, most likely helped by a winter that, so far, has proved to be milder than feared by most. The weak euro may also have played a role in supporting Equities. The German DAX is up more than 12% over the past month.
Chinese Equities have also performed very nicely gaining around 11% over the past 30 days, helped by technical factors as well some positive news and talks coming out of the region.
At the bottom of the performance chart, we find the NDX with a gain of around 3.7% over the past month despite yields deflating in the US with for instance, the 10-year moving from 4.34% at its peak to around 3.83% on Friday.
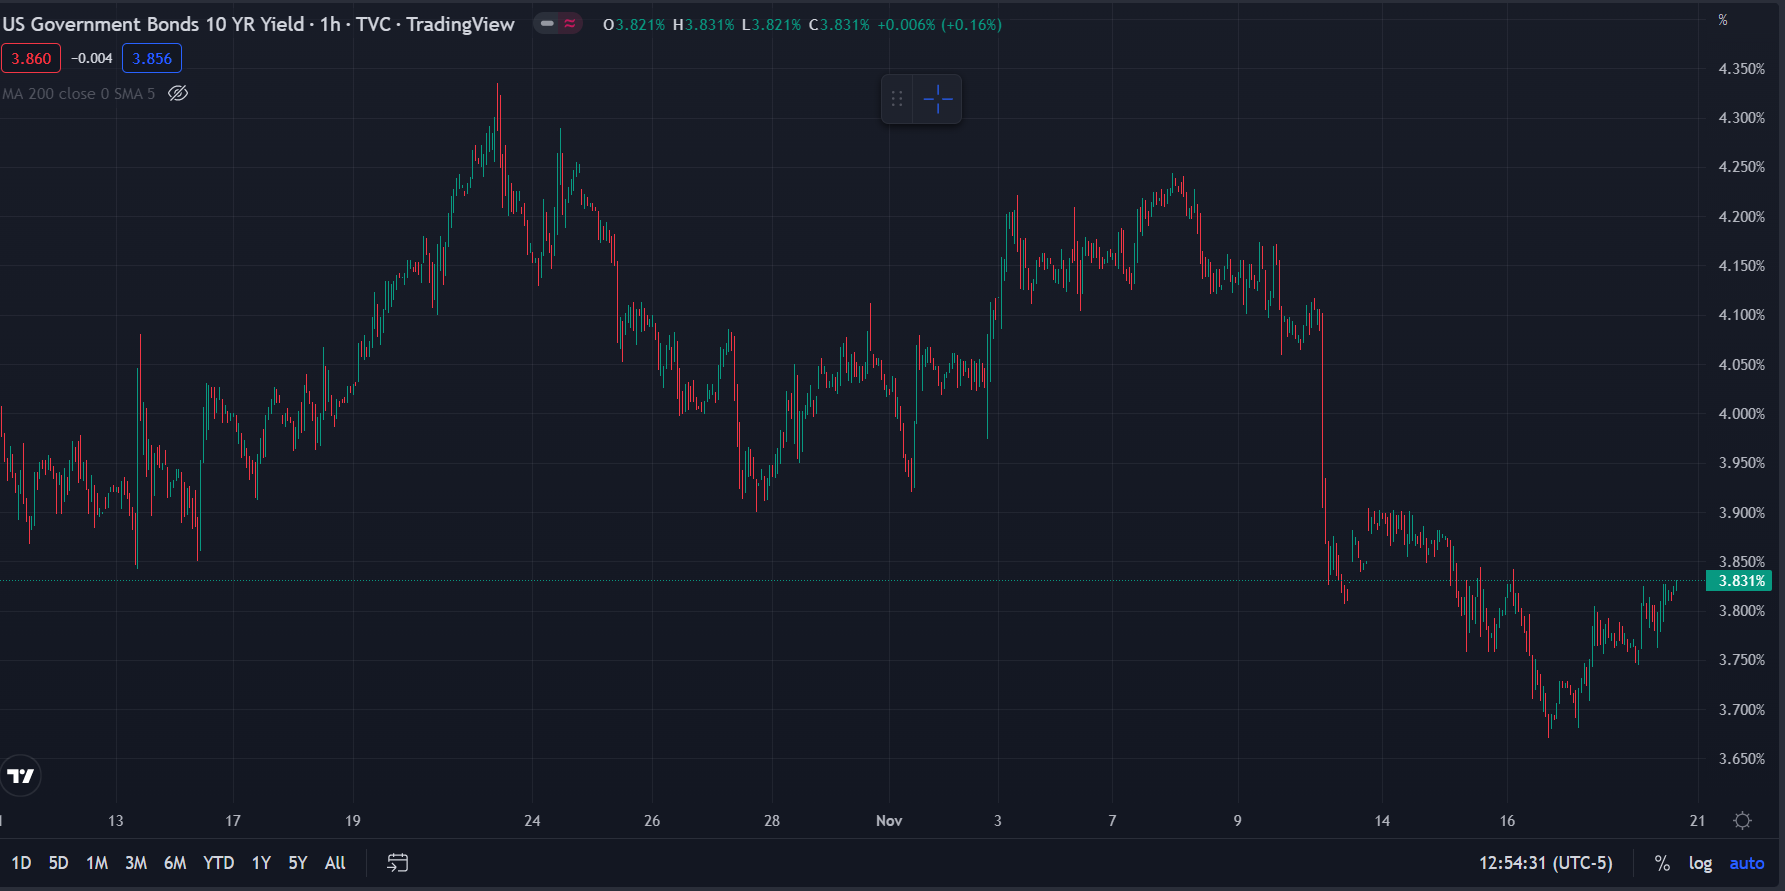
Source: Tradingview.com
Turning over to volatility, we start by looking at the change in IV for the NDX over the past week and over the past month. The below term structure chart highlights those changes.
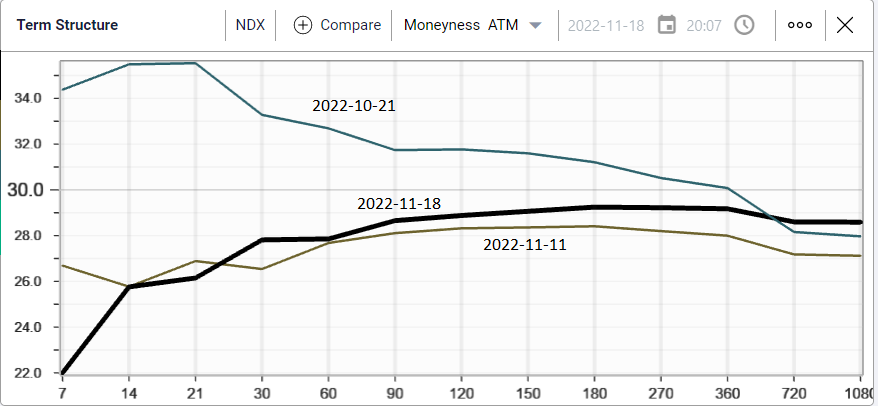
First, we can see that, at the time of the Oct’22 expiration date, options market makers were anticipating a significant amount of volatility in the short run. This was mostly driven by the presence of highly anticipated macro events and releases (NFPs - CPI - FOMC etc.) and now that those are out of the way, options traders are looking for a much more benign trading environment over the next few weeks.
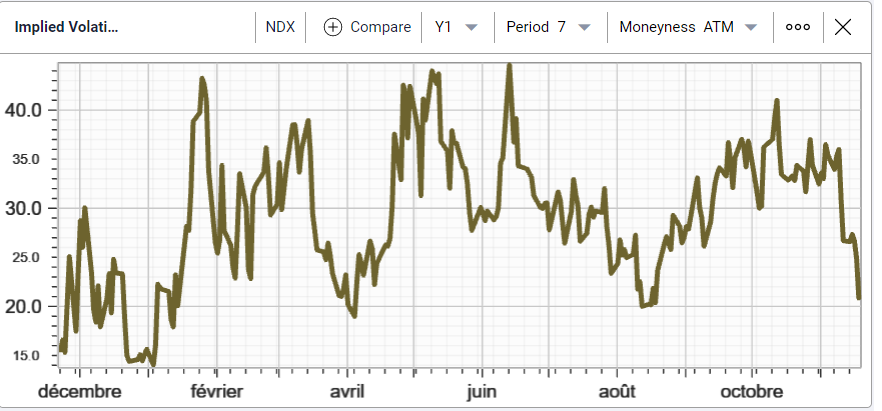
To be precise, the expectations for 1-week implied volatility in the NDX are around the lowest they have been in 2022.
A second observation that can be made is that the expectations formulated by market makers for intermediate implied volatilities (30 to 90 days) have remained fairly steady over the past week.
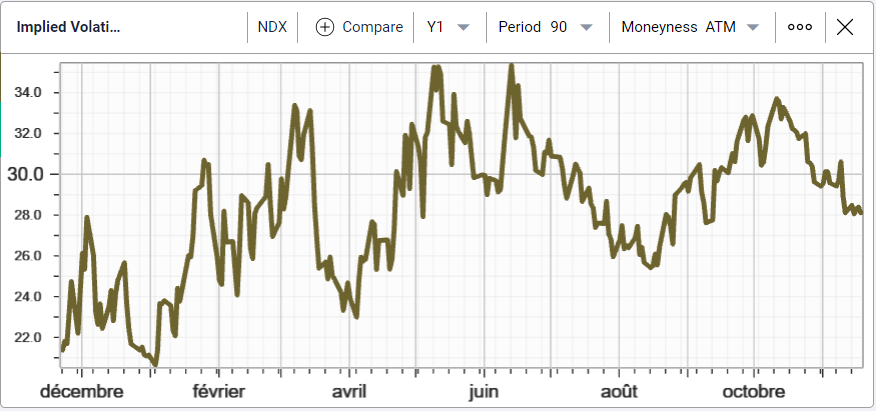
Looking at 90 days ATM implied volatility, we can see that reluctance to push IV much lower for now.
The stability of the implied volatilities over the past week is not limited to the NDX but can be found on the DAX as well shown below and using the same color code as the NDX term structure chart.
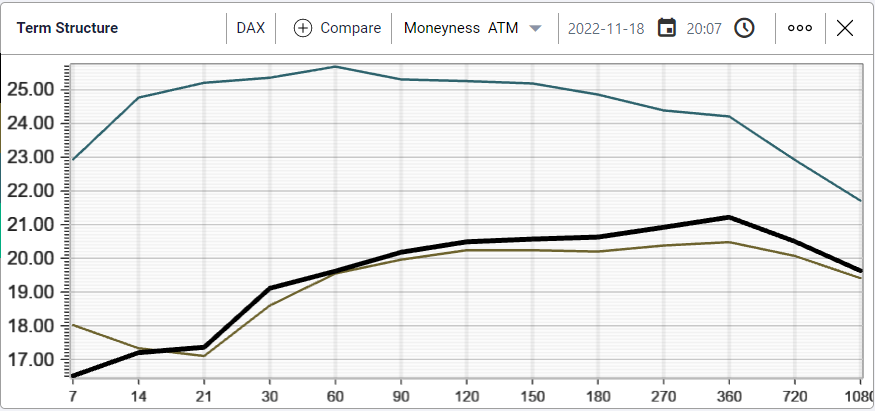
Following a very significant remark lower in implied volatilities across the curve, we are now seeing market makers unwilling to push IVs much lower. Note that for the DAX, the implied volatility remark, even for intermediate terms, has been much more aggressive than what was seen in the NDX.

The above chart displays the 90d implied volatility index for the German DAX over the past 12 month. We can see that we are pretty much trading at the lowest levels seen over the past year.
This creates an interesting situation where the German DAX is trading pretty much at its largest IV discount to the NDX over the past 12 months when measured using 90d ATM implied volatility.
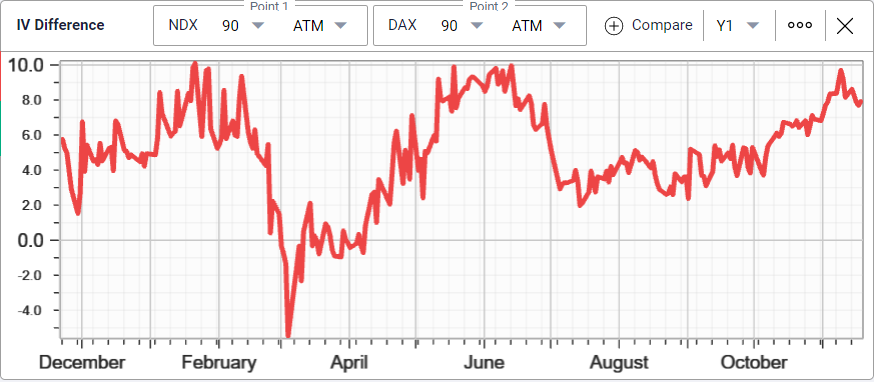
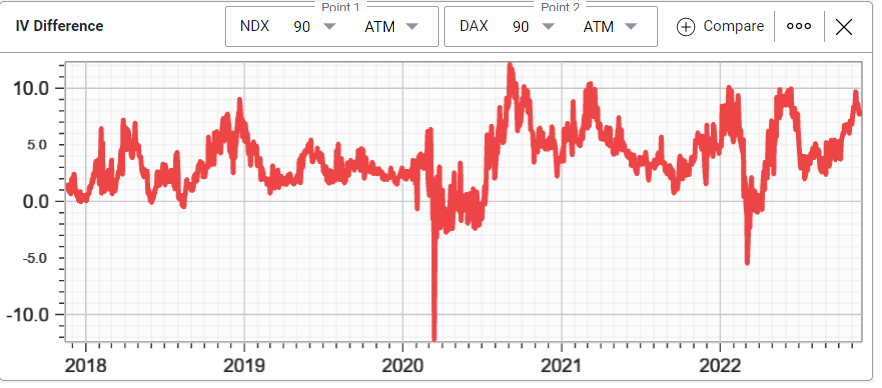
In fact, to emphasize the importance of that level, we can even look at a 5-year chart shown below displaying how, the German DAX barely ever trades at more than a 10-point discount to the NDX.
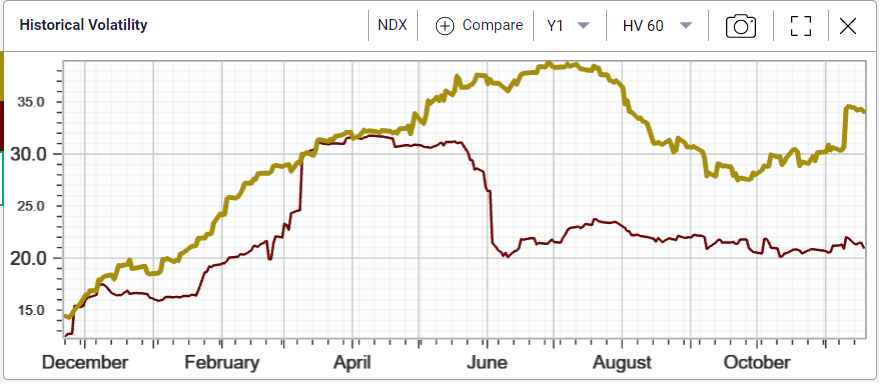
This phenomenon is first and foremost driven by the realized volatility environment, one where the NDX continues to outperform the German DAX by around 13% when measured by using 60-days historical volatility.
Against this backdrop, it is likely that traders will be studying the FOMC minutes on Wednesday to assess in greater detail the approach favored by the committee.