Minutes out and a strong rally in TSLA
November 24, 2022
The highly anticipated FED minutes report confirmed what most in the market had been expecting: FED members are looking to slow the pace of increases in order to assess the impact on the economy.
The report was enough to send equity prices back towards their highest levels of the day following a mid-day selloff.
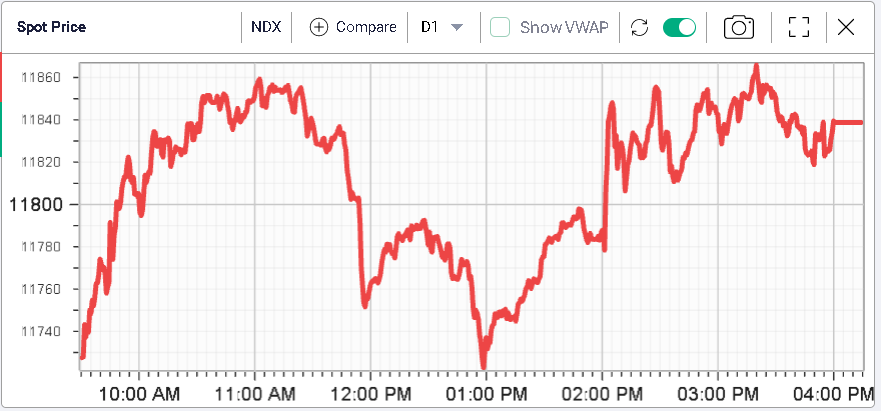
The overall range was pretty limited with the NDX trading around 120 points from high to low.
The NDX gained slightly less than 1%, the SPX was 0.6% higher by the bell and the DJIA finished 0.3% higher.
Technically, there is still a lot of attention around the top-end of the recent downtrend in the NDX as shown on the below chart from tradingview.com.
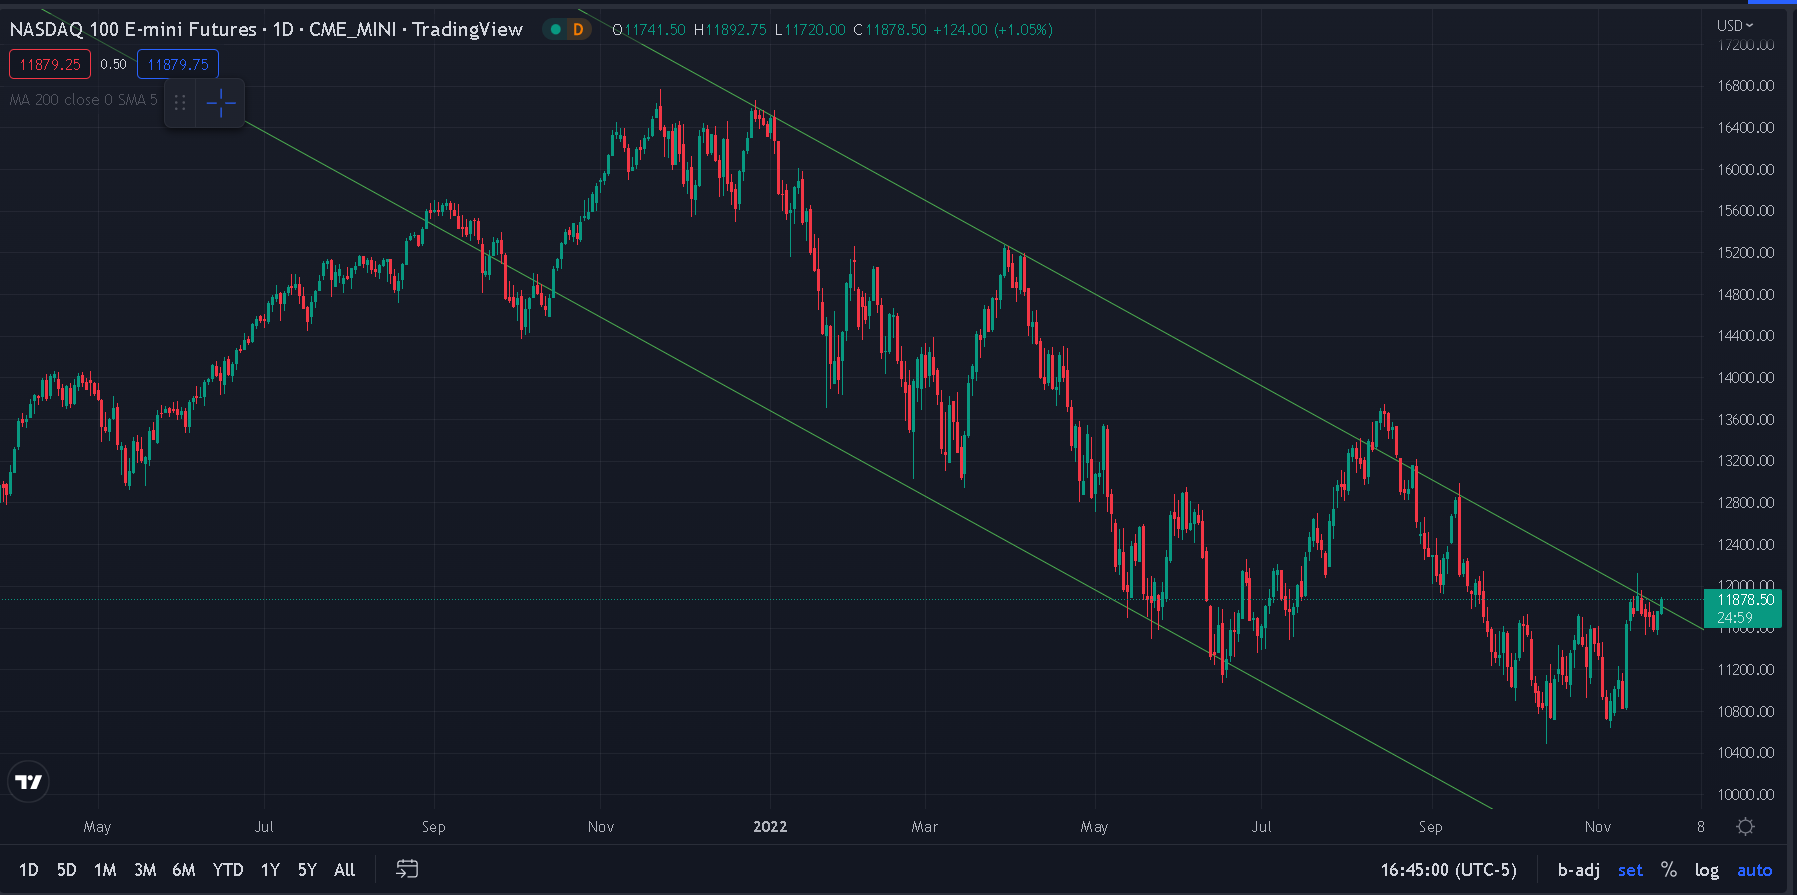
The market seems to have broken out but it will be interesting to watch whether this will be sustained following the Thanksgiving holiday season.
From a volatility perspective, implied volatilities were slightly lower across the curve with 30d IVX on the NDX losing around 1 point on the day.
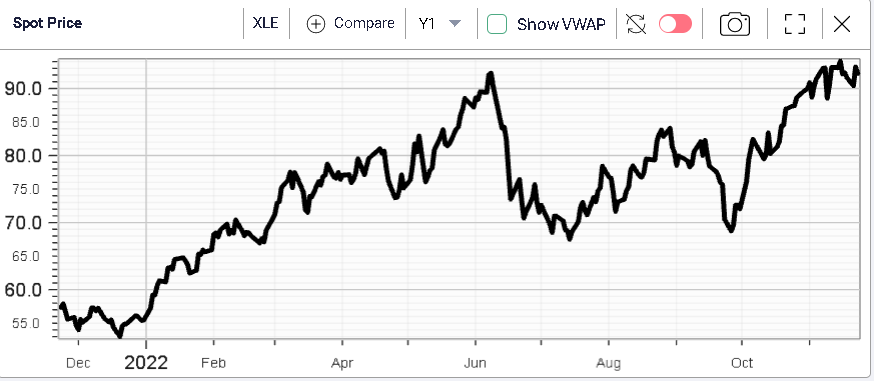
Looking at the sectors’ level, we find that the energy segment was trailing the pack as Oil lost around 4% today on talks of a Russian oil cap and a strong build-up in gasoline inventories in the US as reported by Reuters.
The energy sector is unchanged over the past week but still up almost 6% over the past month and the YTD performance is around +61%.
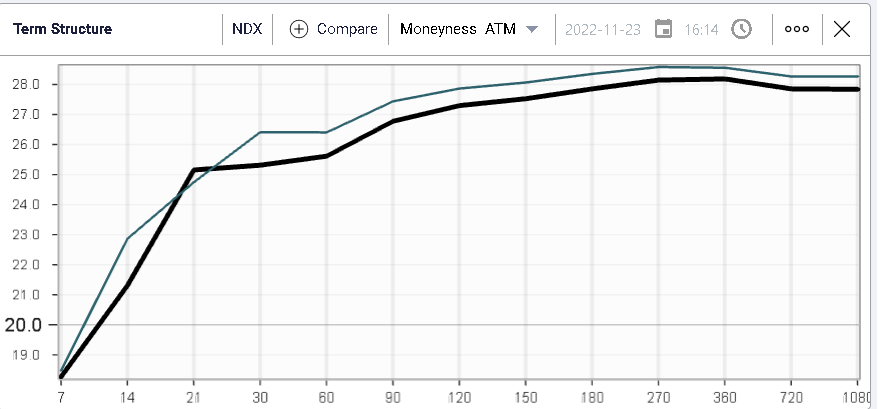
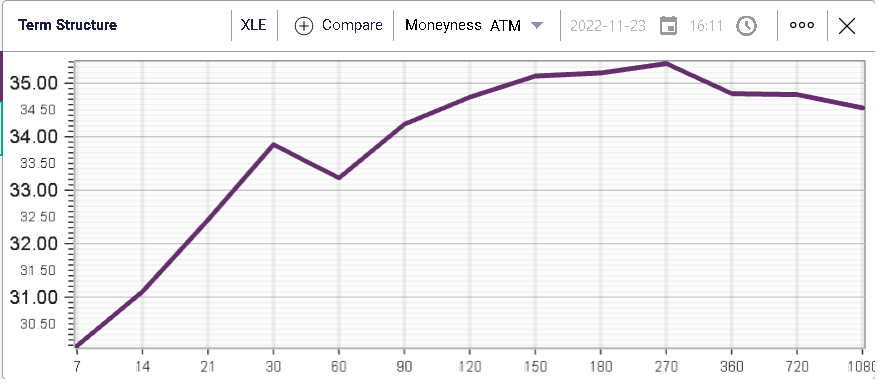
From a volatility perspective, the XLE term structure shown below shows that the market continues to anticipate a relatively elevated volatility for medium to long term maturities with 90 days IVX around 34%.
On the upside, the best performing sector was the consumer discretionary segment which gained almost 1.5% over the day.
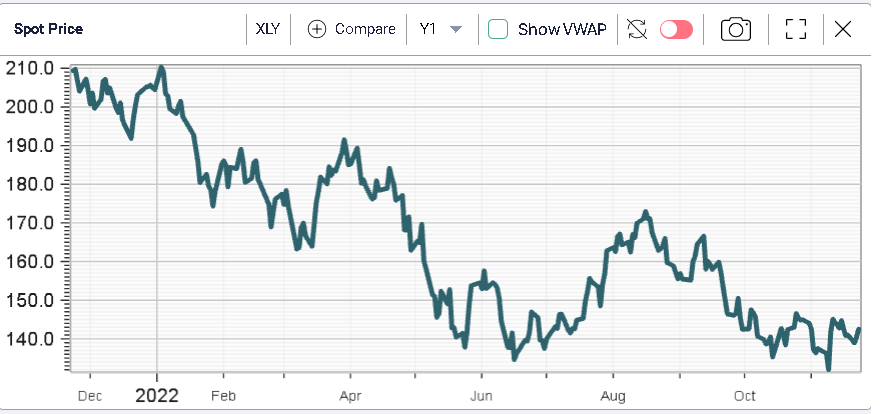
Do note that over the past week and month, the sector is essentially unchanged.
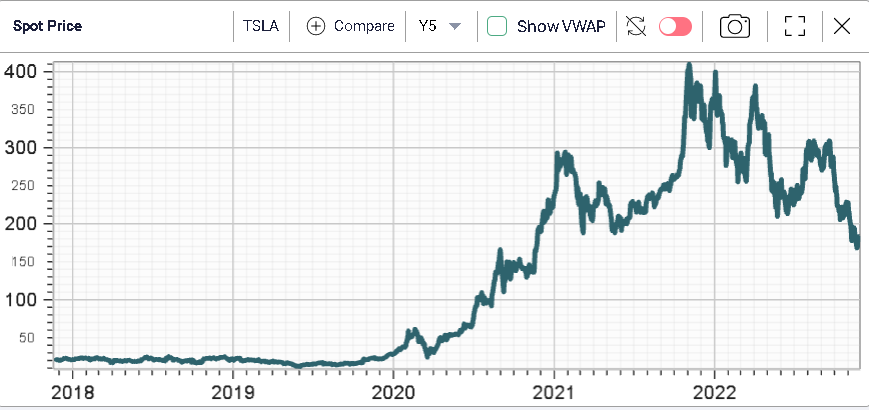
Looking at single stocks, the main story was probably found in TSLA which gained almost 8% over the session. The stock has been under significant pressure since the $400 highs seen at the end of 2021.
CNBC attributed the move higher to an upgrade by an investment bank (Citi) and talks from Elon Musk that the opening of a new factory in South Korea was on the cards.
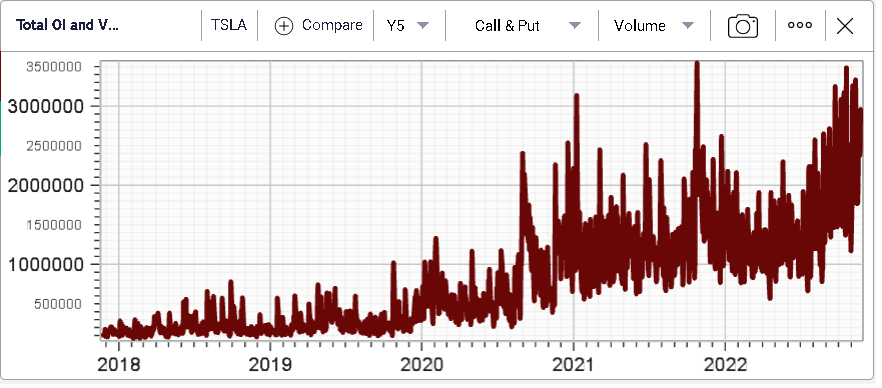
Over the past 12 months, TSLA is still trading around 54% lower than where it finished 2021. Options volumes in the name have been increasing of late as shown on the below chart.
All in all, the market was pretty steady as traders prepared for the final stretch of 2022 post the Thanksgiving holiday season.