Big week ahead
November 28, 2022
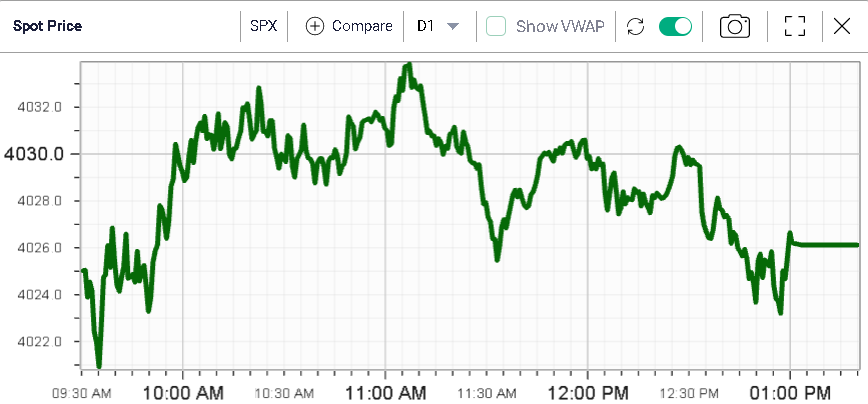
A fairly quiet week with a holiday on Thursday and a half day on Friday during which the SPX did very little and settled unchanged after trading in a 12 points range.
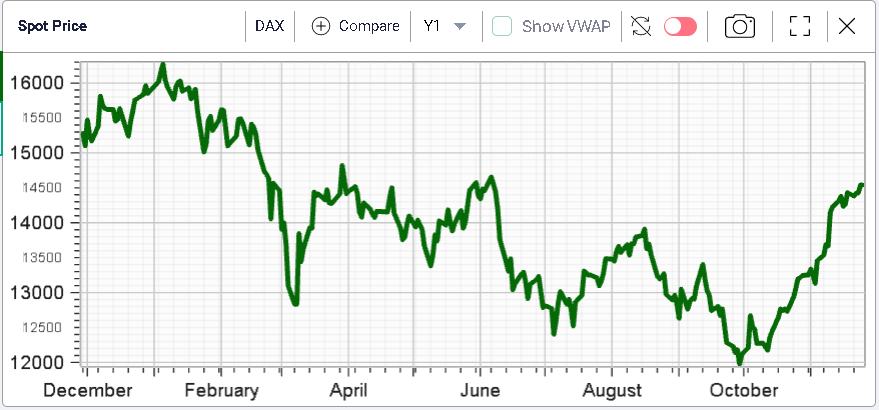
Looking at last week’s performance, all major indices finished in the green except for the HSCEI which lost around 2.5%. The DJIA remained the best performing index gaining around 2.5% while the SPX managed to push 2% higher over the past week. Europe lagged slightly and settled less than 1% higher although the performance of European indices since the beginning of October has surprised many investors.
We have highlighted the below break-out chart from the DAX Futures but it has been making the rounds again over the past week.
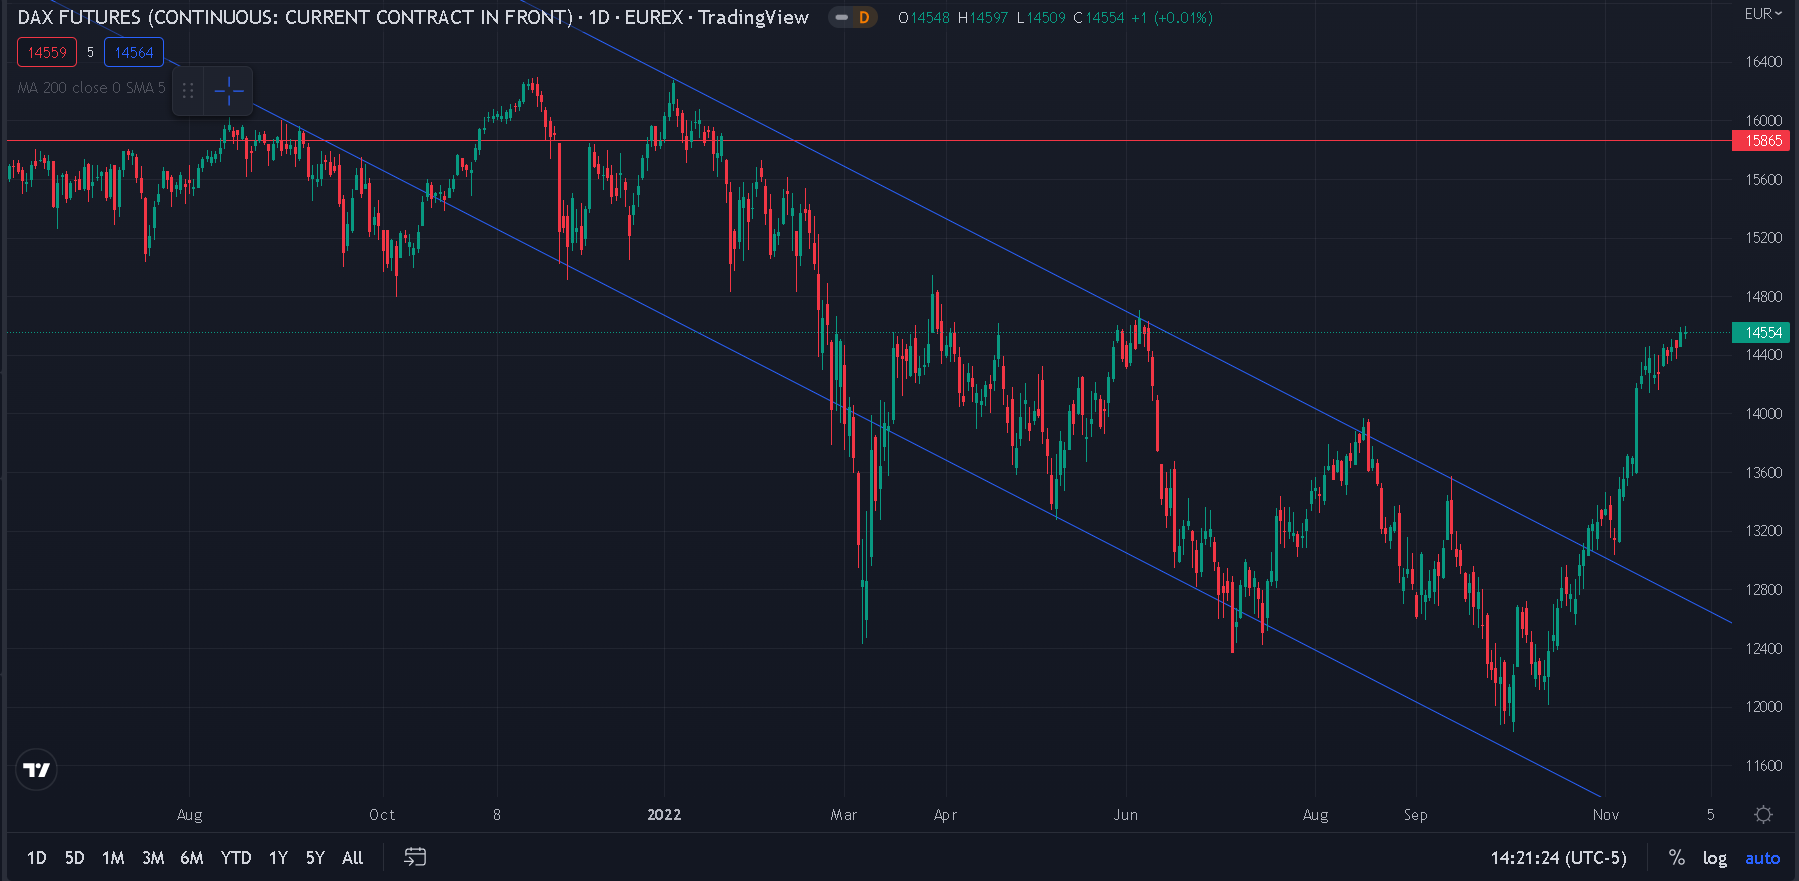
This has been a textbook breakout with a clear downtrend followed by a breakout and a retest before a very powerful move higher. The German index has now reached its Jun’22 levels.
The DAX is now only 9% lower on the year and a few market commentators have been asking whether the DAX could finish unchanged on the year. Using our probability calculator, we are able to partly weight into this debate by deriving an options market implied probability of the German DAX trading around 15884.86 (unchanged on the year) on or by the 30th Dec’22.
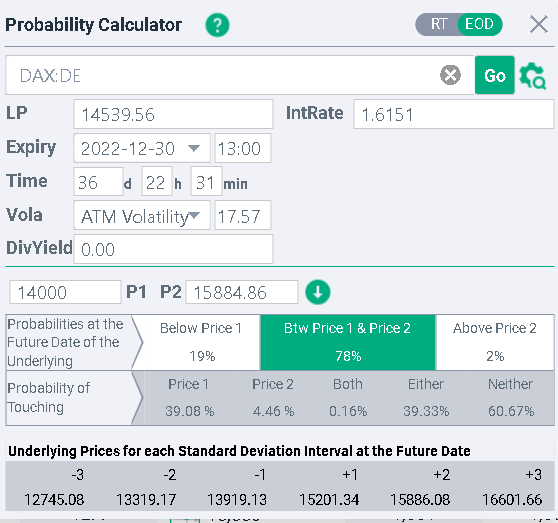
The above shows that, the theoretical probability assigned by the options market to the DAX finishing above 15884.86 on the 30th Dec’22 is around 2% and the probability of hitting that level at any point before the 30th Dec’22 is around 4.5%.
Looking at sectors last week, the Utilities segment was the best performing line gaining more than 5%.
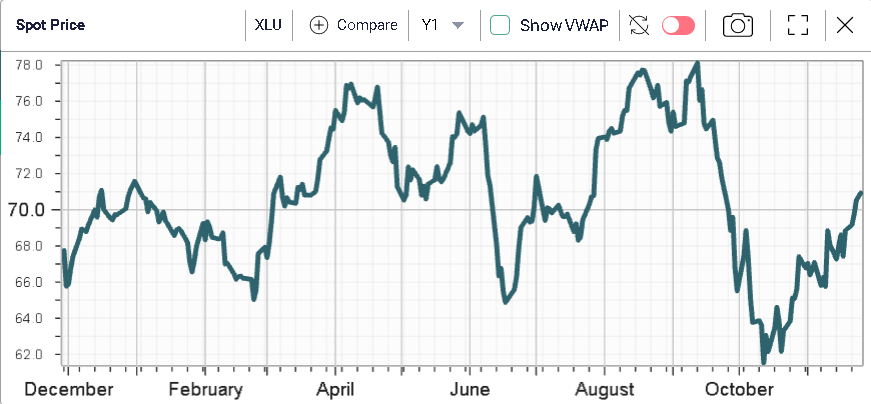
The sector is now up on the year by around 0.1% and after a difficult period from September to early October, it seems that traders have been happy to consider that sector again as interest rates have stopped rising.
Materials also performed well last week, finishing around 3.5% higher. The sector is around 8% lower than where it started the year.
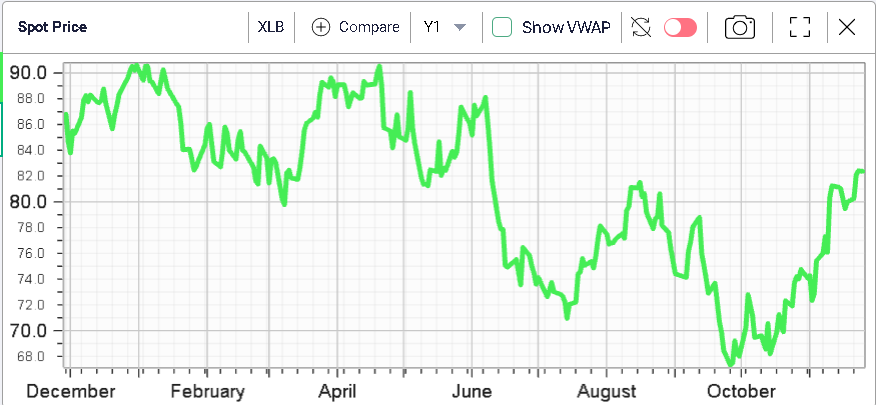
Despite this strong rally in spot prices, implied volatilities have remained fairly steady for the XLB.
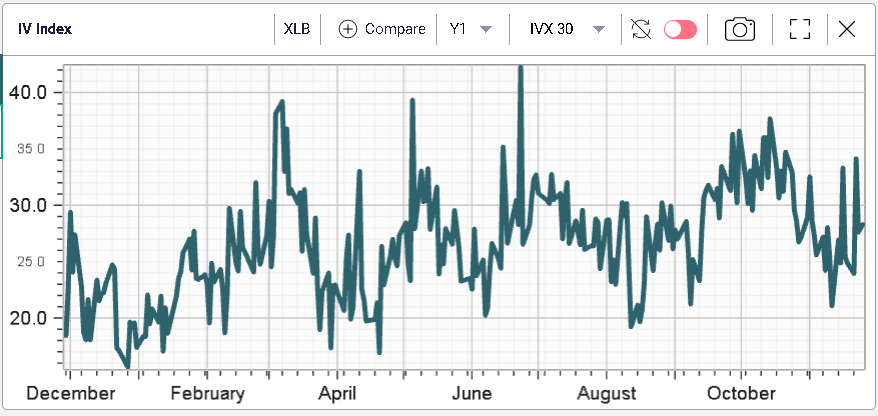
The above chart highlights the 12 months performance of the 30d IVX on the ETF.
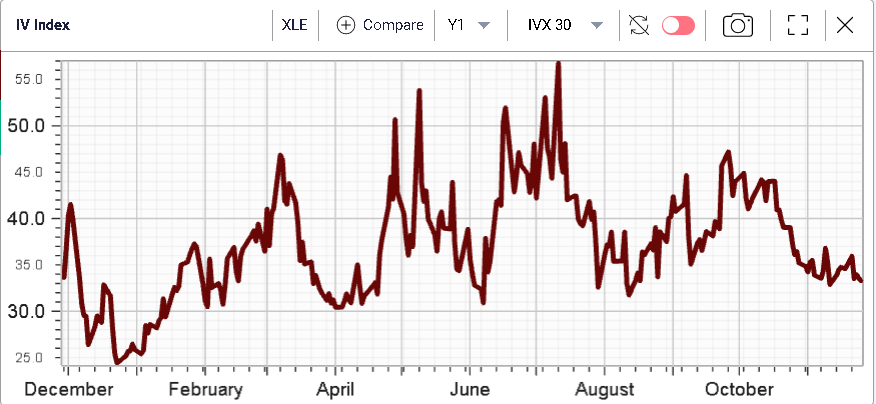
At the bottom of the pack, we can flag the Energy segment which was essentially flat over the past week.

As things seem to settle down in the space, implied volatility has dropped with for instance the IVX30 moving towards its lows of 2022.
Looking at the best performing stocks over the past week, we must highlight BBY which gained more than 15%. Media reports attributed the move to the release of better than anticipated earnings by the company.
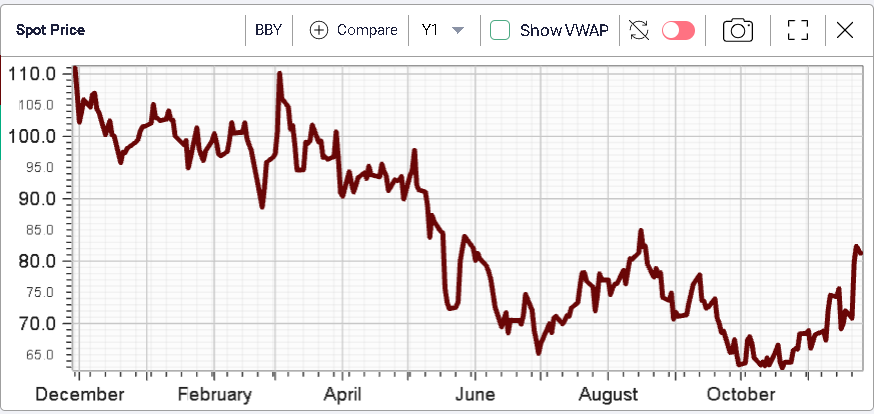
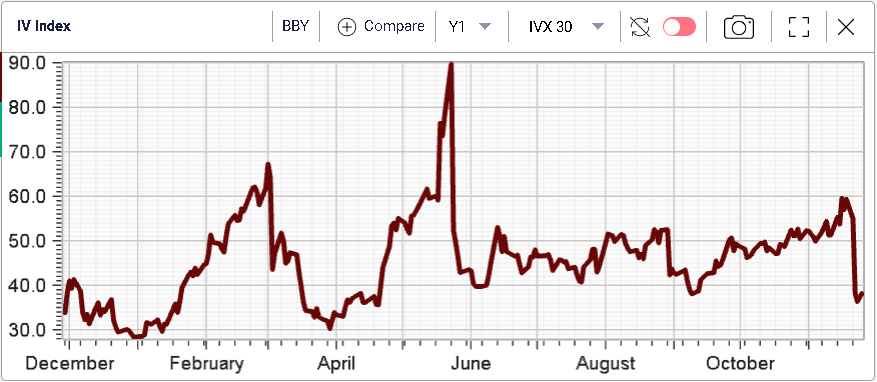
As evidenced by the stock price performance, there had been concerns amongst investors about the impact on BBY’s performance of the current environment. Following a summer downgrade to its outlook, the company seems to have better hopes for the next few months. The stock is now around 20.5% lower on the year and the implied volatility in the name has pretty much dropped to its 12 months lows.
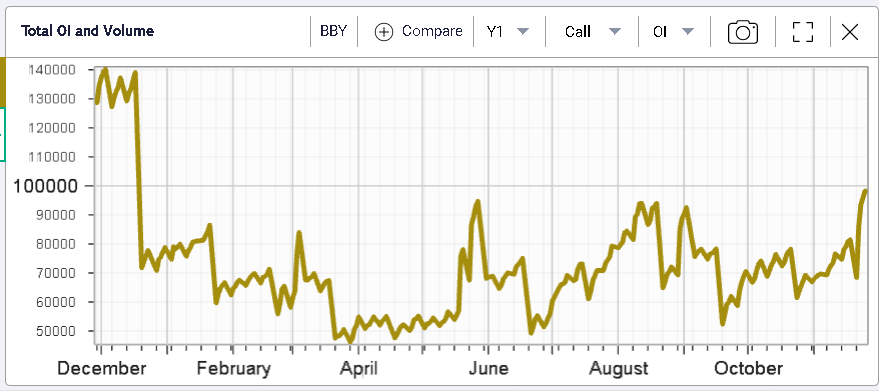
Call open interest has also jumped to 12 months highs in the name as shown on the below chart.
Next week, traders will most likely focus on European inflation figures on Tuesday, culminating with the German HICP YoY expected around 11.3%. On Wednesday, Germany will also release its unemployment numbers with the unemployment rate expected around 5.5%.
On Wednesday, the ADP will give a first look at the employment situation in the US with the market looking for 200K job creation over the prior month. On Thursday, the US PCE will be announced with current expectations hovering around 6% YoY. Finally, on Friday, traders will analyze the latest employment report by the BLS in the US. The unemployment rate is anticipated around 3.7% and monthly payrolls are seen adding 200K jobs.