Concerns around China, Retailers outperform
November 29, 2022
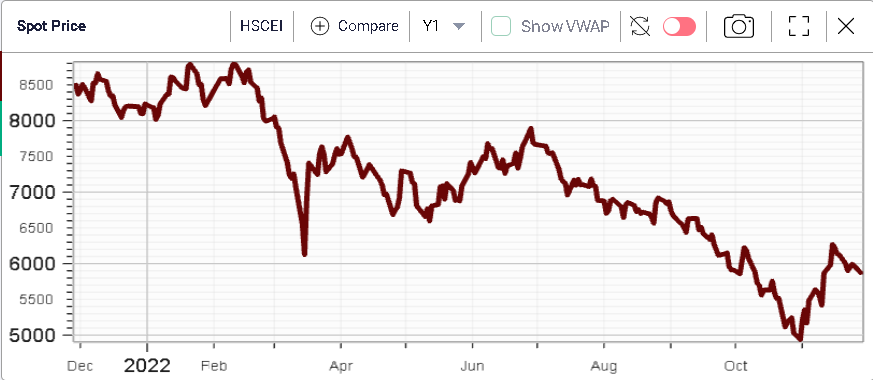
Equity indices started the week on the backfoot as the market focused on protests in China. Chinese equity indices underperformed with the HSCEI losing 1.65% over the session.
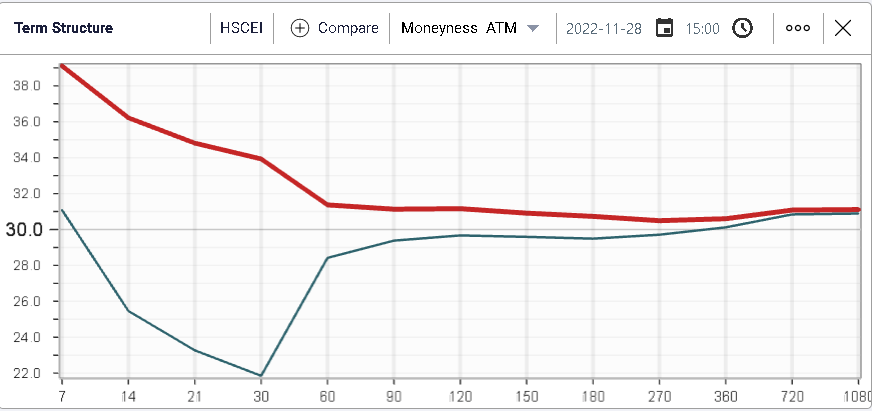
The implied volatility term structure reacted fairly violently with 1-week options moving from around 31% to 39% as traders reacted to the headlines.
US Equity indices also sold off, partly on the back of Chinese concerns but also as hawkish comments from FOMC Williams were reported by media outlets. The president of the New York FED was said, according to the FT, to expect the unemployment rate to rise from 3.7% currently to between 4.5% and 5% by the end of 2023.
Yields were pretty stable over the session with the 10-year trading around 3.68%. Despite this, Real Estate stocks were under meaningful pressure over the day and finished almost 3% lower by the close.
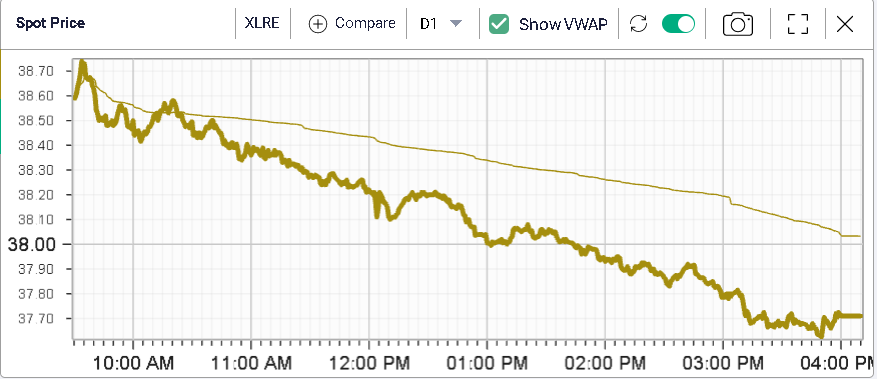
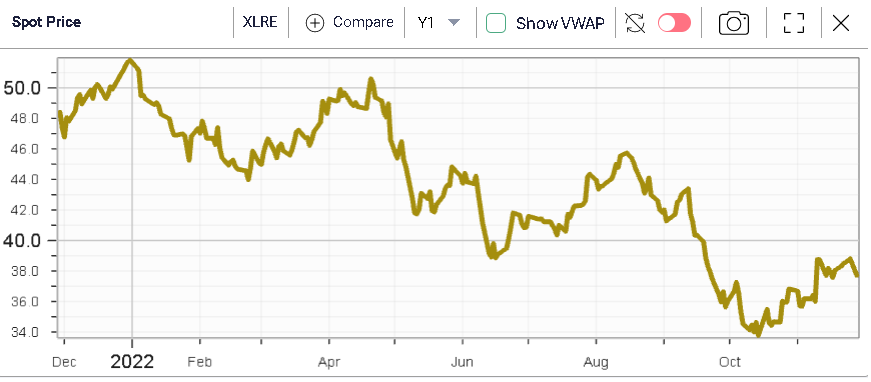
The sector has struggled in 2022 with a YTD performance of -27%.
The energy space also sold off over the day losing 2.7% as Crude Oil trades below $74, its lowest level since December 2021.
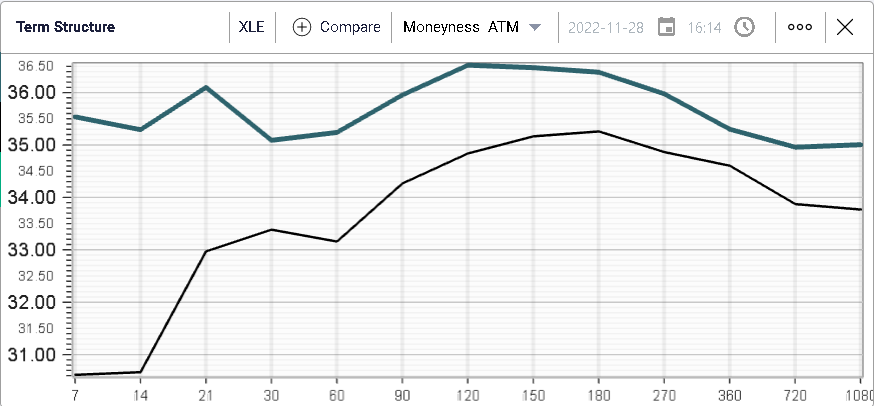
The term structure chart above shows that options traders have now started to be more concerned about a potential move in Energy stocks as short dated options remarked the most over the session.
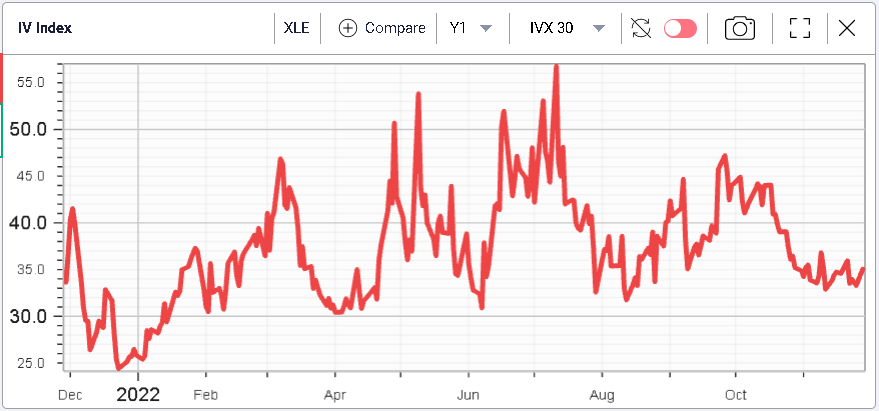
To put this move into perspective, we are still quite far from the highs seen around 50% over the past 12 months for the 30d IVX which is currently around 35%.
Consumer related sectors seemed to fare slightly better on Monday with Staples losing only 0.4% and Discretionary stocks losing 0.6%, both outperforming the broader index.
Early indications from Black Friday sales seemed to be pointing to a better than anticipated outcome. SHOP for instance gained around 3.4%.
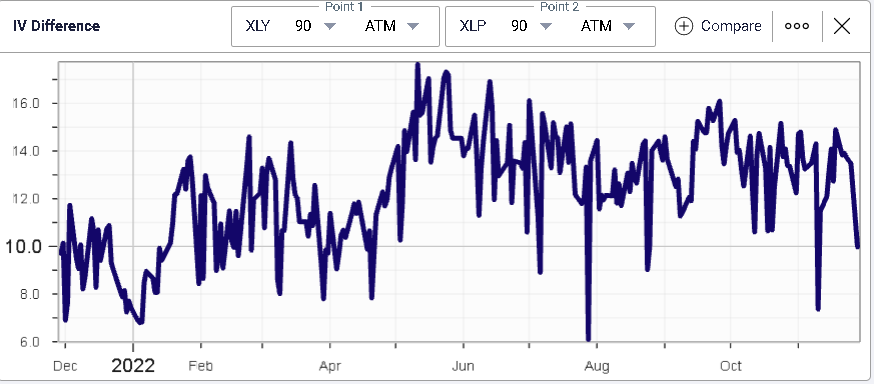
Both sectors have shown very different performances over 2022 with Consumer staples acting as significantly more defensive than Consumer Discretionary. The below charts display the respective performance of the XLP and the XLY over the past year.
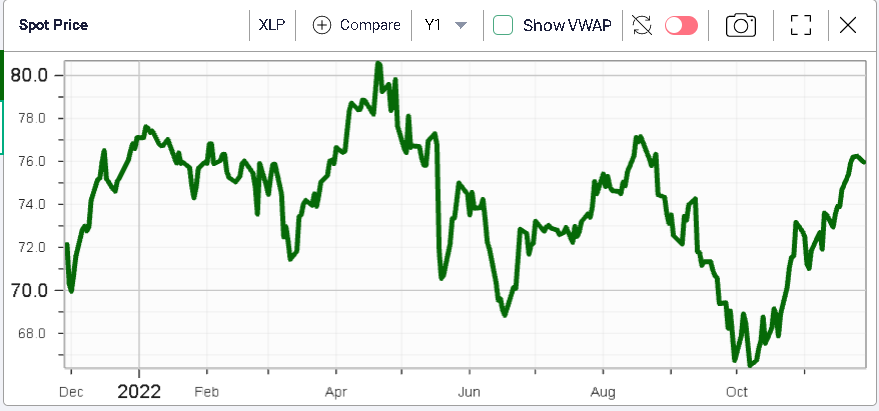
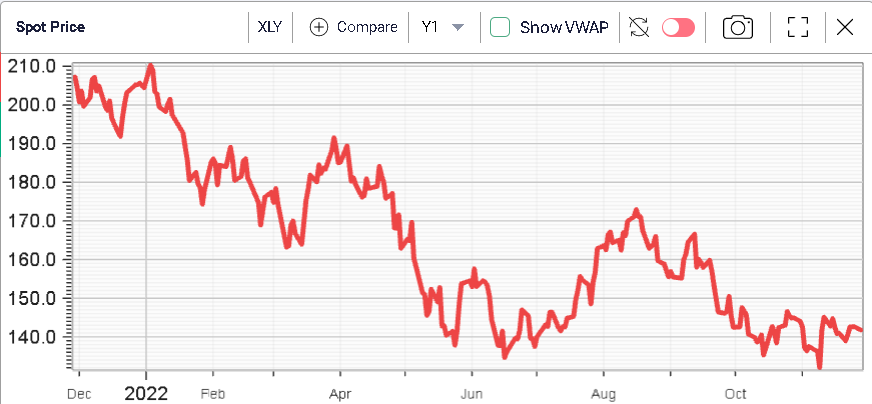
The XLP is down 1.5% in 2022 while the XLY has lost 32.6% YTD. Despite two very different performances for 2022, the implied volatility market is pricing the 90d IV of XLY at pretty much the smallest premium to the 90d IV of the XLP as shown on the below chart which is interesting as we go into 2023.