November finishes in the green, China up 30%
December 1, 2022
Wednesday concluded the final day of November and the market will now be entering the final day of what has been for most a very long and exhausting year.
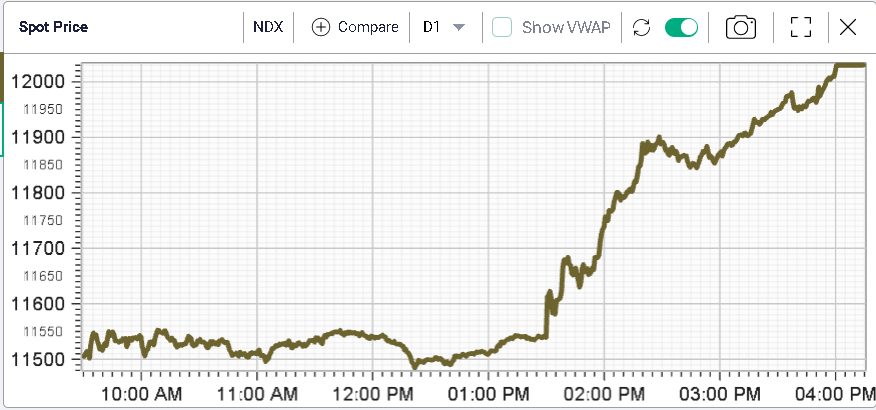
On Wednesday, Equity Indices performed very strongly as traders reacted to the speech from Jerome Powell, indicating that the pace of rate hikes would slow from December 2022.
The NDX reacted very positively and topped the performance charts for the day gaining around 4.6%. The SPX finished around 3.1% higher on the day.
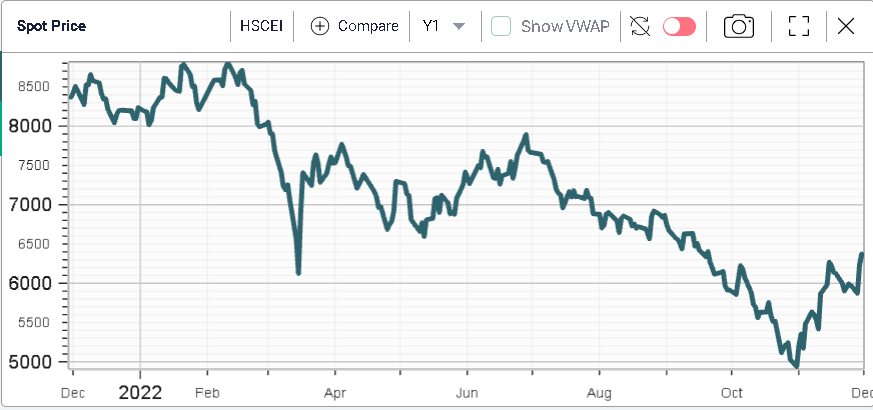
Looking at the past month’s performance, we find that, Chinese Equities did really well and managed to bounce very strongly with a gain of almost 30% for the HSCEI. That staggering performance means that the 6 month performance of the Chinese index is now only -13% while the YTD remains around -22%.
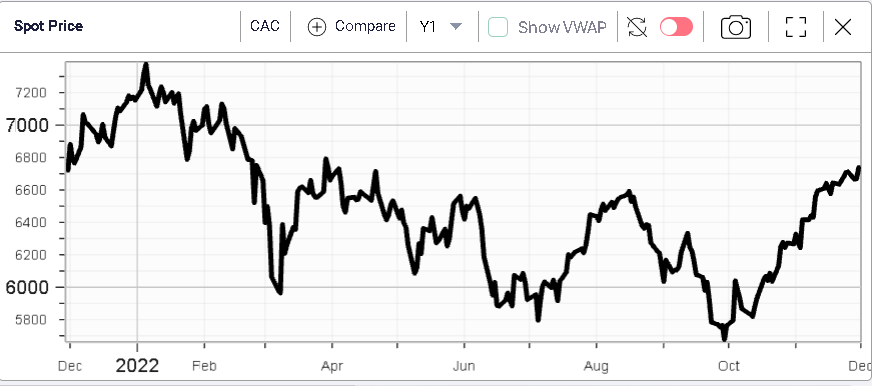
Despite the strong performance yesterday for US indices, European indices actually managed to outperform their US counterparts over the last month. The French CAC finished 7.5% higher on the month and for that index as well, the performance from the lows has been quite impressive.
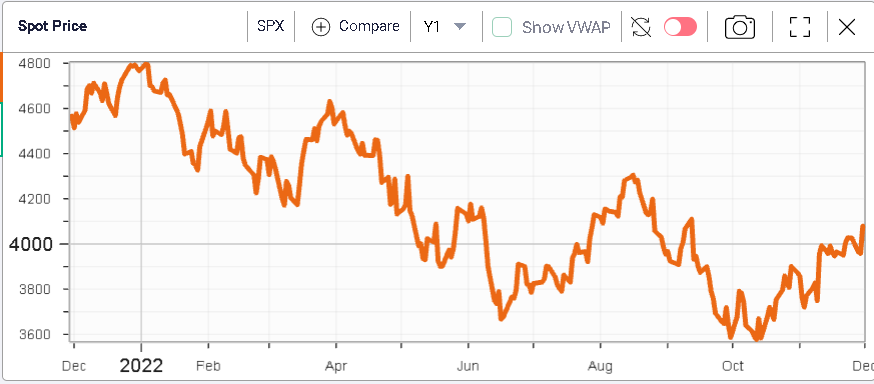
It would be hard to justify that US indices had a difficult month considering that the SPX was up more than 5% and the NDX more than 6% but the positive sentiment around price action may have left traders expecting more.
In order to assess the change in implied volatility over the past month, using the Term Structure chart is probably the simplest way to make a quick evaluation of things.

The above chart displays in blue the SPX term structure as of the 30th Nov’22 while the orange line shows the TS as of the 31st Oct’22.
The drop in short-dated volatility is most impressive with weekly options pricing out 10%. The 30d bucket which is generally considered as the benchmark maturity to evaluate IV changes lost around 5% over the past month.
That shows that to a large extent, the market saw November as a month when perceived risk was significantly reduced, most likely as hopes that inflation may have peaked started to emerge as the inflation reports came out during November.
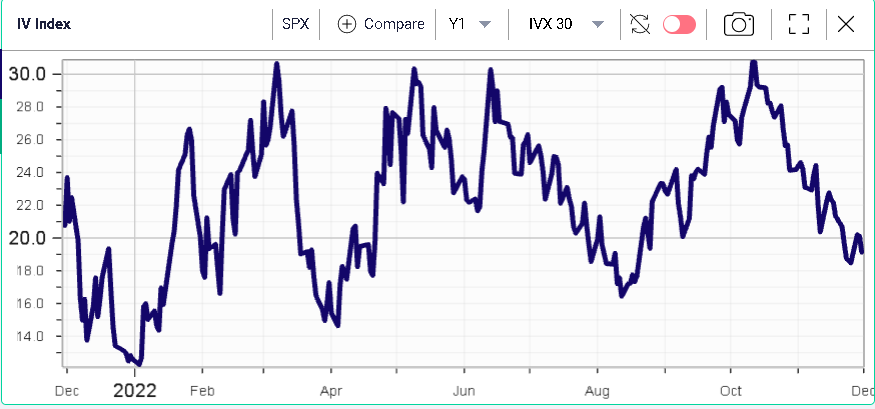
The 30d IVX has now closed below 20% for the first time since late Aug’22. The below 12-month chart for the 30d IVX shows how mean reverting implied volatility has been in 2022 and the significance of the 30% IV level we flagged on multiple occasions.