Traders and the FED agree to disagree for now
December 5, 2022
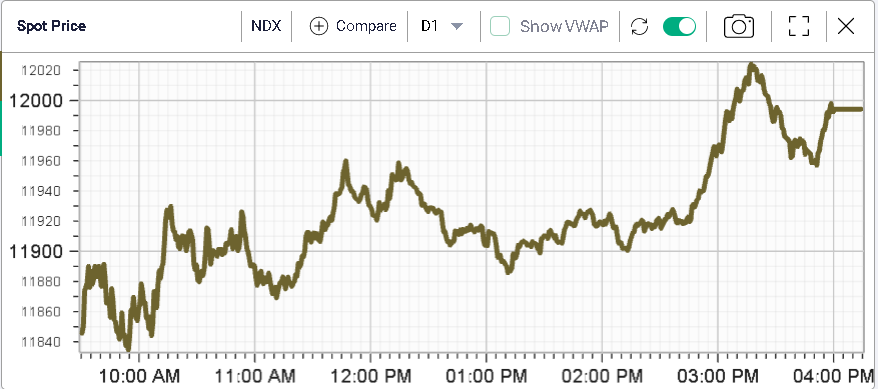
Equity indices finished largely unchanged on Friday despite some movement to the downside following the release of Non-Farms Payrolls.
At the cash open, the NDX was around 1% lower and subsequently rallied throughout the session to finish 0.4% lower.
Implied volatilities deflated as the market was relieved that the release did not result in a much greater volatility. In blue below, we see the term structure for the NDX as of Thursday’s close, in red the TS as of Friday’s open and in yellow the TS as of Friday’s close.

Turning back towards interest rates, an important dislocation has emerged between short term Fixed Income traders and the FOMC. The former are currently expecting peak rates around the middle of 2023 followed by around 0.5% worth of rate cuts by the end of the year 2023. The latter seem to indicate that they do not foresee rate cuts as likely in 2023.
This will be an important theme for 2023. In the meantime, looking at last week’s performance, we note that Chinese Equity Indices continued to perform very strongly wit h a weekly gain around 6.5%. The NDX also performed well finishing the week 2% higher.
Looking below at the downtrend in HSI Futures, we can see that we are now trading against the top-end of that down channel, an important technical indicator that will be watched over the next few weeks.

Source: Tradingview.com
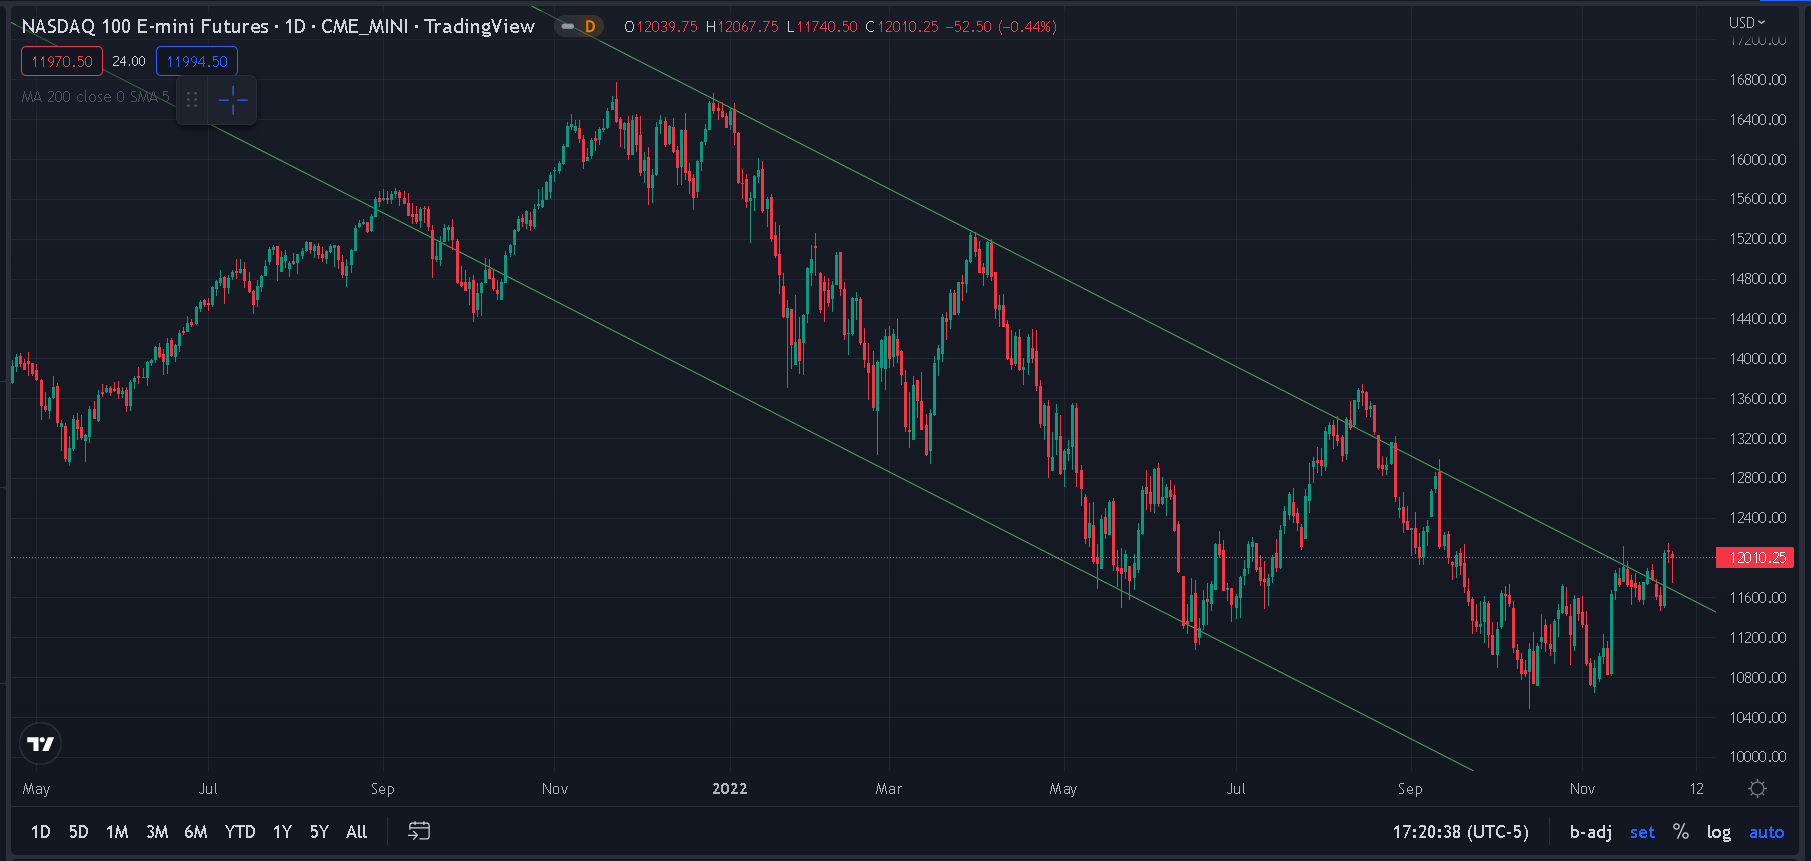
NDX Futures broke out last Wednesday and have for now remained above the upper-end of the downtrend established in 2022.
Source: Tradingview.com
Let us quickly take a look at the single names that were most volatile over the past week.
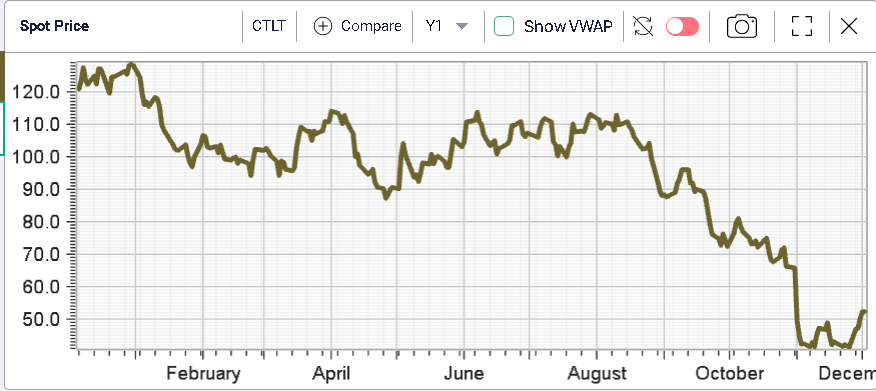
First, CTLT jumped more than 25% over the past week although the name remains 58% YTD.
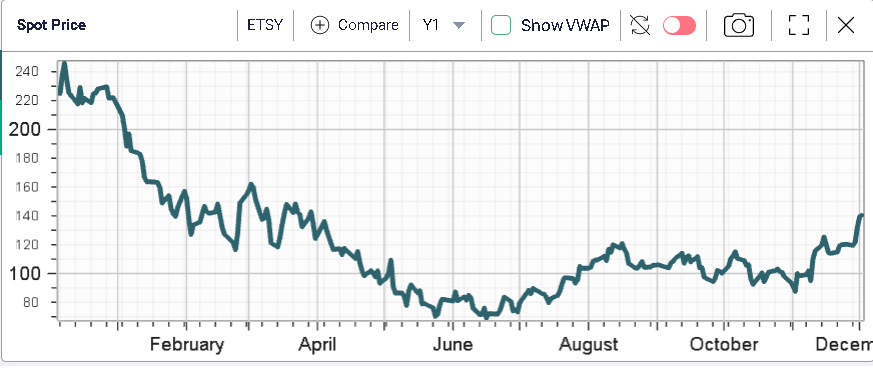
ETSY also performed fairly strongly gaining around 16% over the past five sessions.
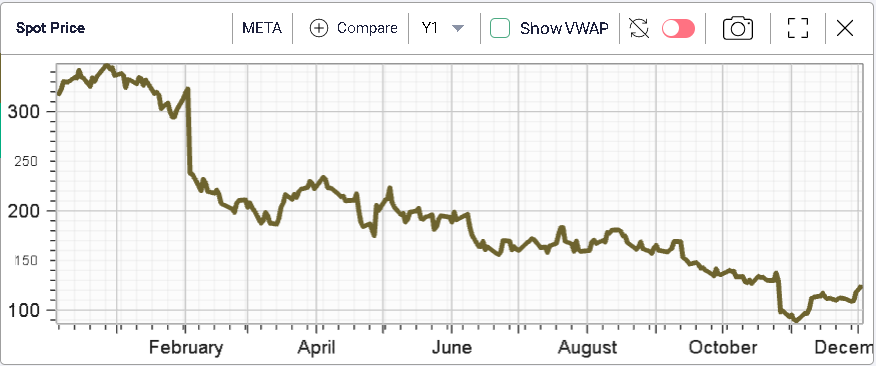
Amongst the large cap names, META showed a pretty good performance up 11% over the past week. The company remains around 63% lower on the year.