Oil selloff - BK Call activity picks up
December 8, 2022
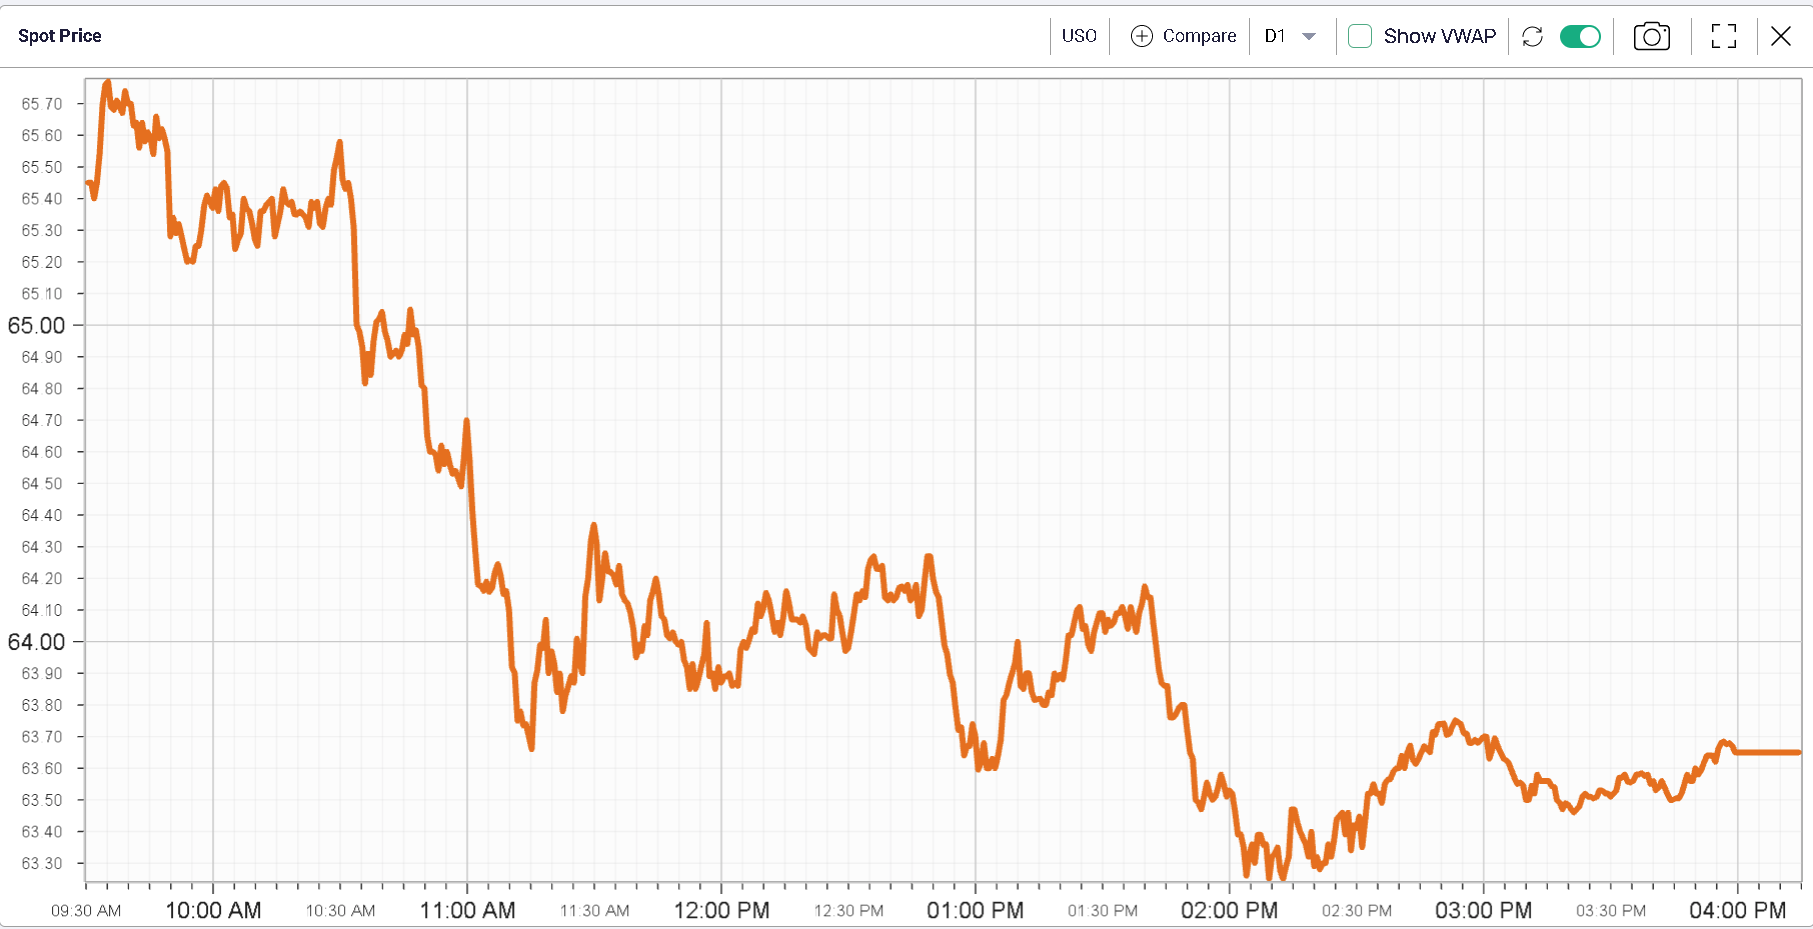
Oil markets continued to selloff on Wednesday with USO losing another 2.4% taking the performance over the last 6 months to -31%. Front-month Crude Oil WTI contracts settled at $72
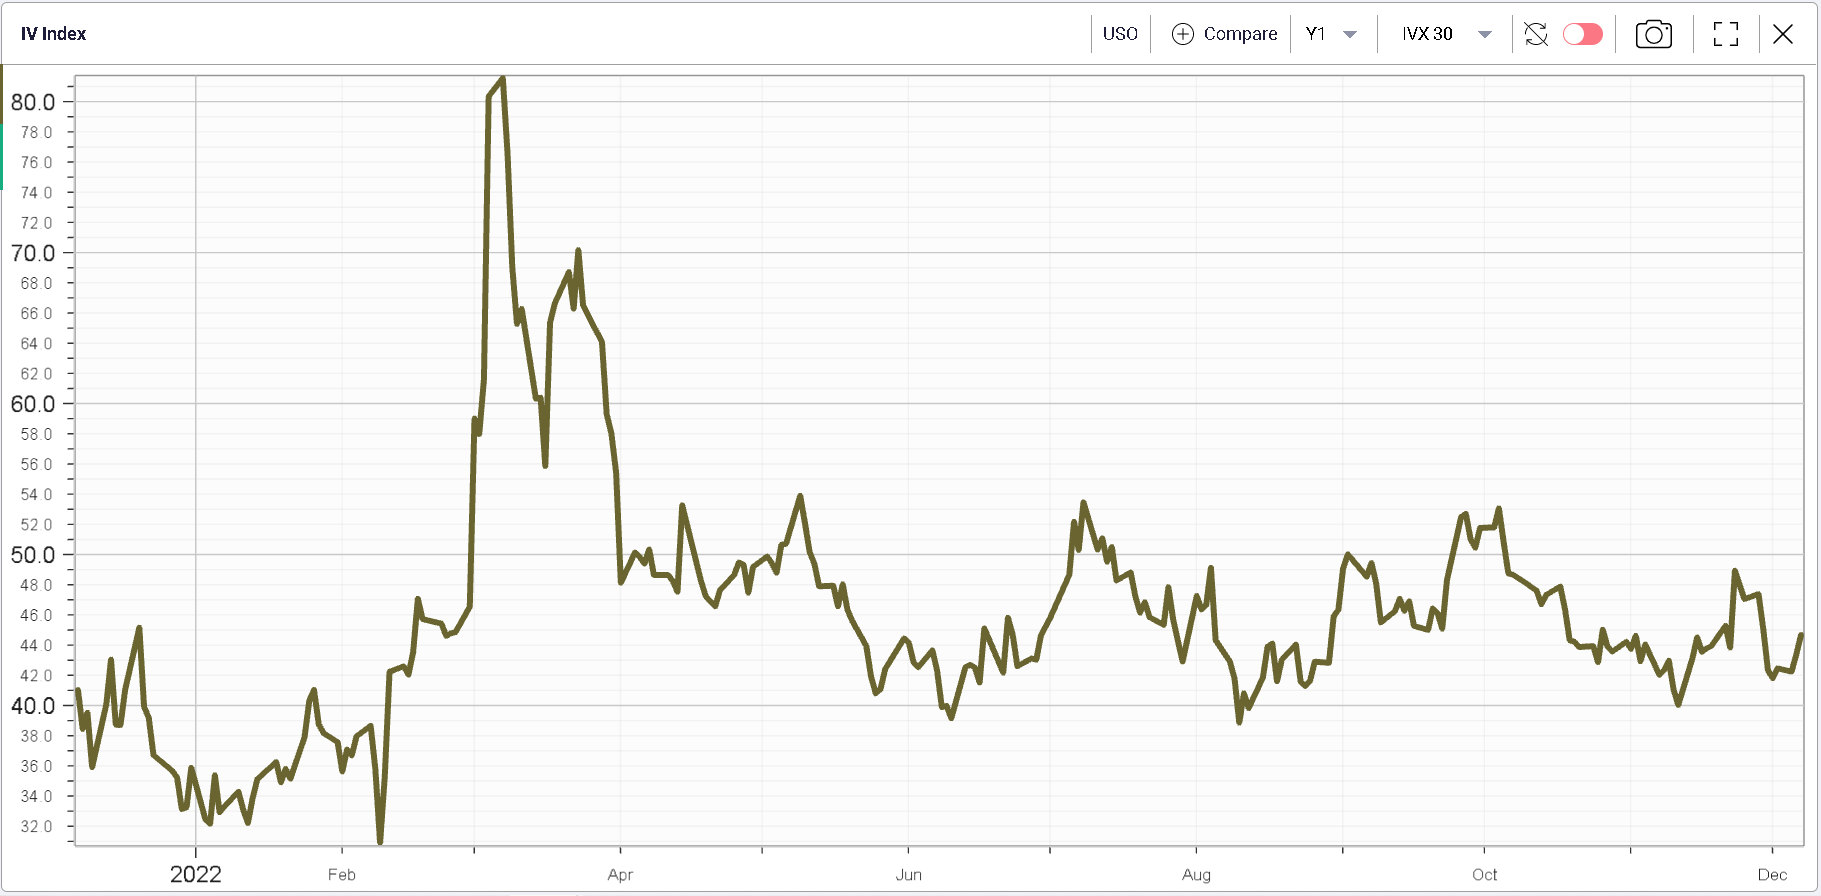
Implied volatility has bounced marginally but remains far off the highs above 80% seen earlier in the year as the war between Ukraine and Russia broke out.
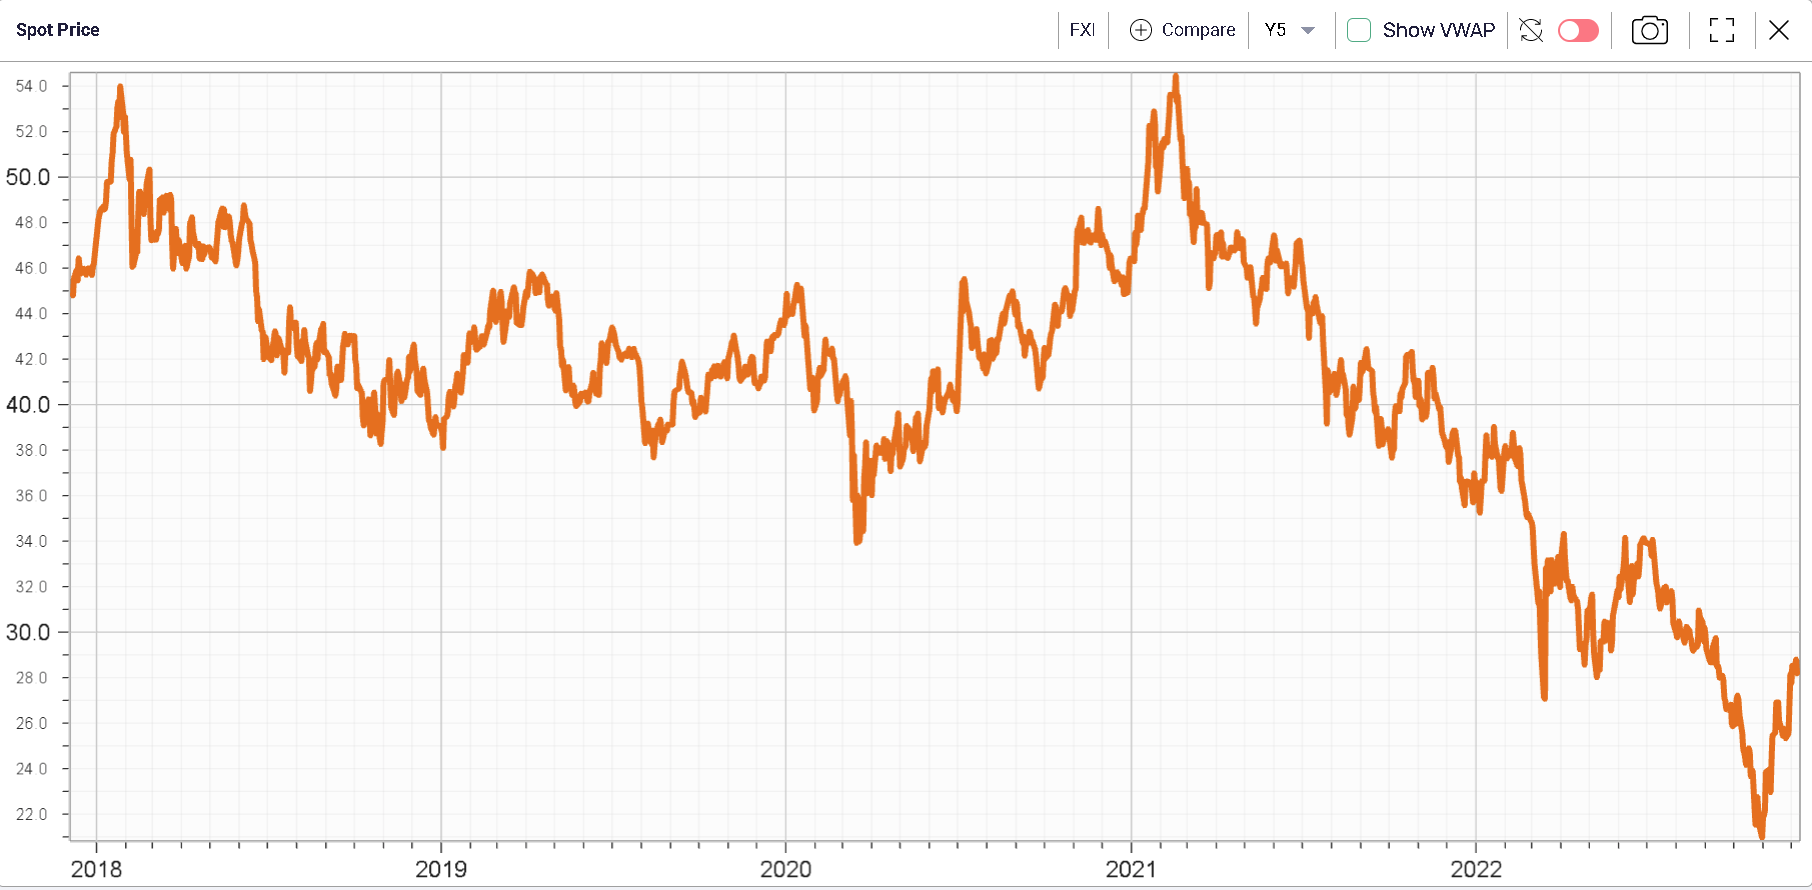
Looking at major indices, we note the strong underperformance of Chinese Equity indices. FXI, one of the main Chinese ETFs listed in the US lost around 2.2% over the day.
The bounce from the bottom has been fairly strong in Chinese Equities so it is possible that we are seeing some profit taking at the index level.
From an implied volatility perspective, options market makers almost seemed reassured by the halt in the recent rally in spot and the small selloff in spot seemed fairly welcome from that perspective. The term structure shown in orange below was snapped on Tuesday night while the red TS was taken on Wednesday night. It shows how the front-end of the curve has been pushed lower by market makers.
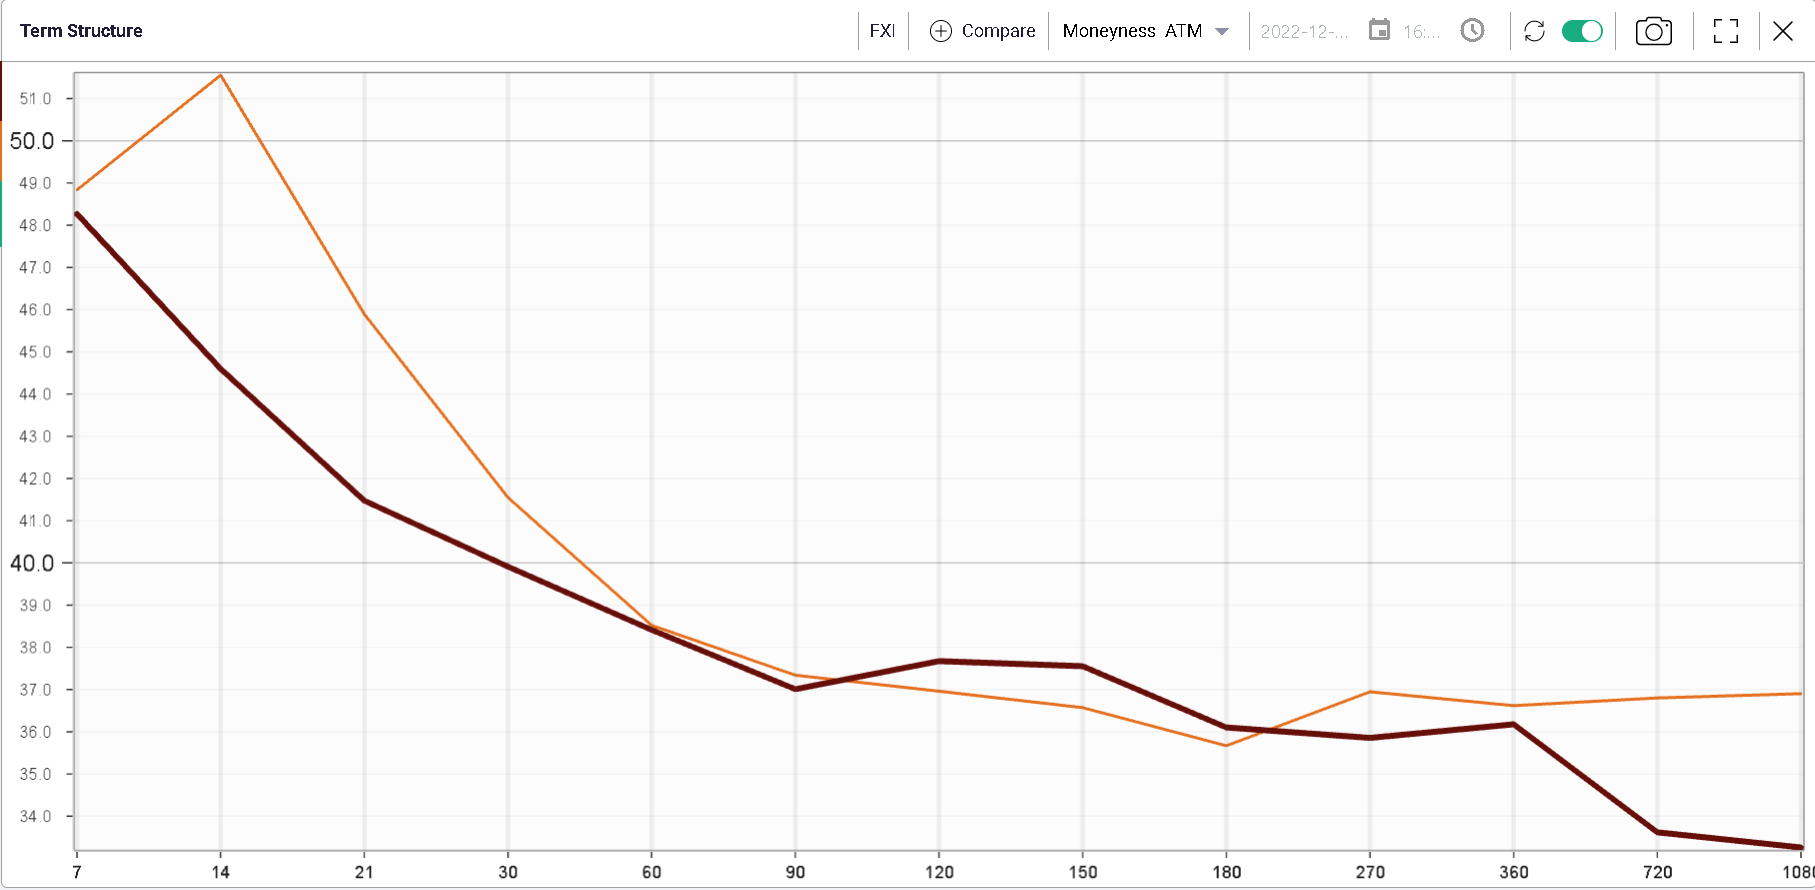
The elevated short dated volatilities are still indicative that the market thinks more moves are likely in the next few days but it is worth keeping an eye on how those evolve in the next few sessions as that thinking might well change.
At the sector level, the overall performance was fairly muted. Healthcare stocks outperformed over the gain gaining slightly more than 0.8% followed by Consumer Staples which finished 0.4% in the green. On the downside, Consumer Discretionary names, Communications and Tech underperformed losing between 0.4% and 0.6% each.
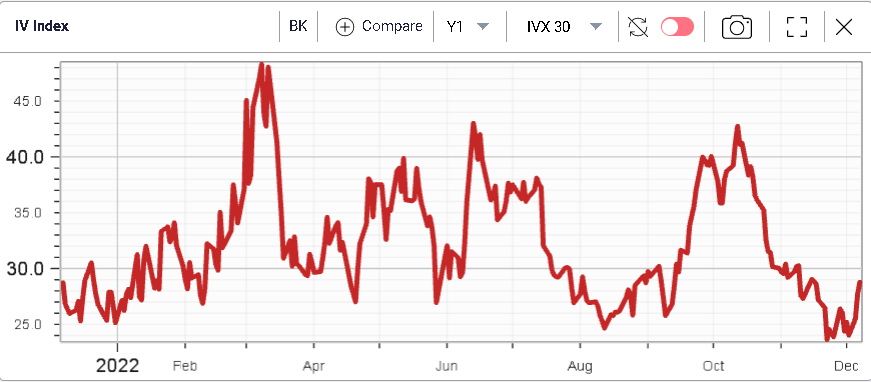
At the single stock level, we note the good performance of BK which finished around 4% in the green.

The name attracted a fairly elevated (at least relative to its own history) number of call contract trades over the day with more than 7,000 calls printing.
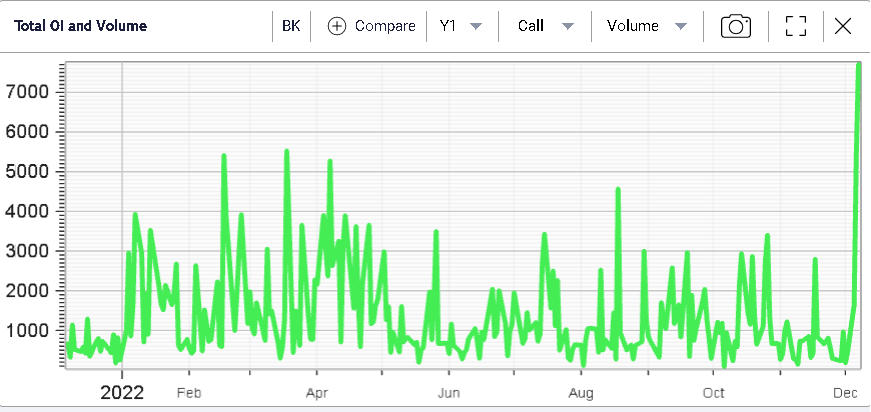
Looking at the open interest on the call side, it has now reached its highest level in 12 months as shown below.

Implied volatility, proxied below by the 30d IVX, has recently reached its 12 months lows and was seen bouncing over the past few days.