Resistance Prevailed | IVolatility.com

Last Week’s Highlights at IVolLive:

  • On Saturday, our experts gave a LIVE walkthrough and demo on the IVolLive platform, including how to trade puts, calls, and spreads as well as how to add features like stocks, charts, the Stock Monitor, and the Profit and Loss Calculator. Watch the video HERE.
  • You can register for any of our upcoming LIVE webinars HERE.
  • You can watch and view any of our past videos on our YouTube channel HERE.
  • Register for a free IVolLive Trial HERE.


Bonds Got the Message

February 13, 2023

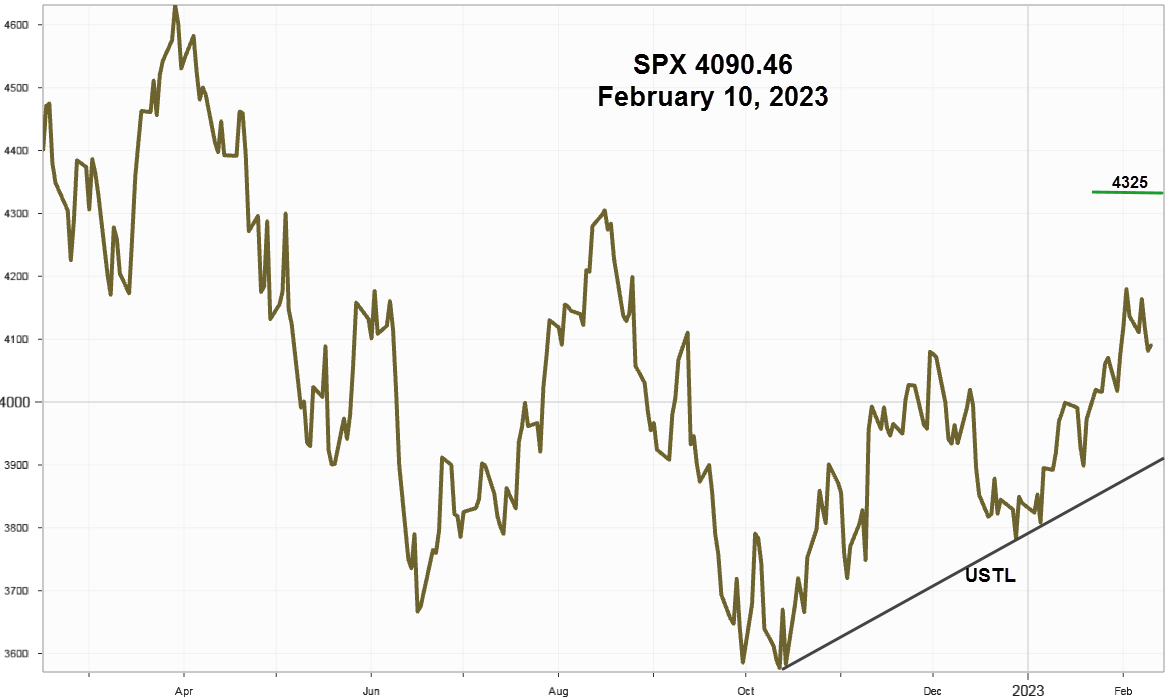
With the benefit of hindsight, it appears the S&P 500 Index reached a high on Thursday February 2, at 4195.44, the day before the Friday February 3 employment report, and marks the likely end to the current rally. Up to that point, More Bull or Bounce? leaned bullish, but that changed last week.

S&P 500 Index (SPX) 4090.46 slid 46.02 points, or -1.11%, last week making a well-defined downward sloping channel that began after the employment report. Although still well above 50 and 200-day Moving Averages, it closed below the first support zone around 4100 from mid December. The chart below shows the current upward sloping trendline (USTL) from the October low without the prior downward sloping trendline or the potential Head & Shoulder Bottom pattern included in last week's chart, but for reference still shows a small horizontal green mark at 4325 that would activate the pattern on higher closes.

Ivolatility spot price chart

As mentioned above, the decline began after on the February 3 employment report as bonds sold off with a noticeable 15 basis points (bps) jump in yield on the 1-Year Treasury Bill to 4.79%. Then on Friday it closed at 4.89%, some 39 bps above the 2-Year Note at 4.50%. For some reason the bond market really dislikes the 1-Year Bill.

As a collaborator the U.S Dollar Index, the index made a pivot low at 100.68 on February 2, then closed at 103.54 up .78 for the week , slightly above the downward sloping 50-day Moving Average.

With signs of speculation returning to the equity market the Federal Reserve brought out several officials last week to remind the markets once again about “higher for longer” and that message arrived. While story could change again after the Consumer Price Index data on Tuesday, the bears prevail until then.

Implied Volatility

SPX 30-day options implied volatility index, IVX gained 2.65 points to end the week at 18.45% while the 7-day IVX advanced 6.14 points to 22.16%, reflecting higher prices for near-term options used for hedging strategies ahead of Tuesday’s CPI release.

Since it eventually reverts to the mean, the 52-week chart shows it at 22.69%, along with the April 4, low at 14.63%.

Ivolatility spot price chart

After challenging the 52-week low on Thursday February 2, and then turning sharply higher, a return to the mean seems likely and something nimble traders may want to consider.

iPath Series B S&P 500 VIX Short-Term Futures ETN (VXX) 12.17 up .85 points or +7.51% for the week. 30-day Implied Volatility Index, IVX, 74.92%, Historical Volatility 38.56%. Down to10.98 on February 1 from 21.76 last October 11, it will quickly move higher when volatility increases. Since it holds VIX futures contracts, and the February contract expires on Wednesday, it will lose some time premium on the roll up to March contracts. Typically deferred contracts trade at higher prices than the front months creating a continuous loss of time premium limiting its usefulness to very short trades. Ahead of the Consumer Price Index on Tuesday, this could be one of those times.

Market Breadth as measured by our preferred gauge, the NYSE ratio adjusted Summation Index that considers the number of issues traded, and reported by McClellan Financial Publications, slipped all week, declining 118.90 points to end the week at 985.55, confirming equities received the Fed's higher rates for longer message.

Summing Up

The combination of the employment report on February 3 and commentary from Federal Reserve officials last week that rates will go higher and stay high longer took its intended toll on both bonds and equities. Rates and the U.S Dollar Index moved noticeably higher while equities could have been helped somewhat from earnings reports. This week the focus shifts to the Consumer Price Index.

Words such as odds and likely appear often since investing and trading rely a lot on probabilities often determined by looking at the historical record.

Previous issues are located under the News tab on our website.

Disclaimer - This information is provided for general information and marketing purposes only. The content of the presentation does not constitute investment advice or a recommendation. IVolatility.com and its partners do not guarantee that this information is error free. The data shown in this presentation are not necessarily real time data. IVolatility.com and its partners will not be liable for any loss or damage, including without limitation, any loss of profit, which may arise directly or indirectly from the use or reliance on the information. When trading, you should consider whether you can afford to take the high risk of losing your money. You should not make decisions that are only based on the information provided in this video. Please be aware that information and research based on historical data or performance do not guarantee future performance or results. Past performance is not necessarily indicative of future results, and any person acting on this information does so entirely at their own risk.
Important Cookie Information
We use the minimal necessary cookies to ensure that we give you the best experience on our website. You must accept cookies in order to use our website. Learn more about privacy at IVolatility.
I Accept