Last Week’s Highlights at IVolLive:
- Register HERE for our next free, live webinar that we will be hosting tomorrow at 12 Noon EST. This webinar is titled How to Use Stock Charts, S&P 500 Charts, VIX Charts, and other Volatility Measures to Design Options Trades. Fundamental and technical analysis are useful tools in options trading. But there's another factor that really moves stock and options prices: sentiment. Understanding sentiment can be the difference maker when creating profitable options trades like puts, calls, and spreads. Join us for this free, live webinar where we will show viewers how to harness the powerful Sentiment Analyzer in IVolLive to create actionable options trades today.
- In this live webinar, our experts will demonstrate how to access Stock, Charts, S&P 500 Charts, Options Charts, VIX Charts, and other volatility charts in the IVolLive platform to design and analyze actionable, put, call, and spread trades.
- On Saturday, our experts gave a LIVE walkthrough and demo on the IVolLive platform, including how to trade puts, calls, and spreads as well as how to add features like stocks, charts, the Stock Monitor, and the Profit and Loss Calculator. Watch the video HERE.
- You can register for any of our upcoming LIVE webinars HERE.
- You can watch and view any of our past videos on our YouTube channel HERE.
- Register for a free IVolLive Trial HERE.
Rates Relief
March 7, 2023
After the yield on U.S. 10Y Treasury Note ended above 4% on both Wednesday and Thursday, bond buyers jumped on long duration Friday pushing the 10 year yield back down eleven basis points (bps) to end the week at 3.97%. Equities got the message, as all sectors ended in the green.
S&P 500 Index (SPX) 4015.64, up 75.60 points or +1.90% for the week closing near the high on Friday. First supported by the 200-day Moving Average on Thursday and then boosted off the 50-day MA on Friday like bouncing up from a springboard as long duration interest rates pulled back.
Now the odds favor more upside, first to the previous February 2nd high at 4195.44, then the August 16th high at 4325.78 (chart below) where it will likely encounter enough resistance to keep it in a range defined by the October 14th low and the August 16th high.
In the meantime, in addition to rates it's also about rotation, selling overbought sectors and buying oversold sectors, with fundamentals sitting in the back seat.

Thursday's low along with Friday's gain confirmed the starting point for the operative upward sloping trendline (USTL) at the October 14, low of 3579.68 a day after the wide range reversal low at 3491.58, disregarding the extreme range low.
Implied Volatility
SPX 30-day options implied volatility index, IVX pulled back 2.71 points to end the week at 17.22%. The 7-day IVX declined .29 points to end at 16.80%.
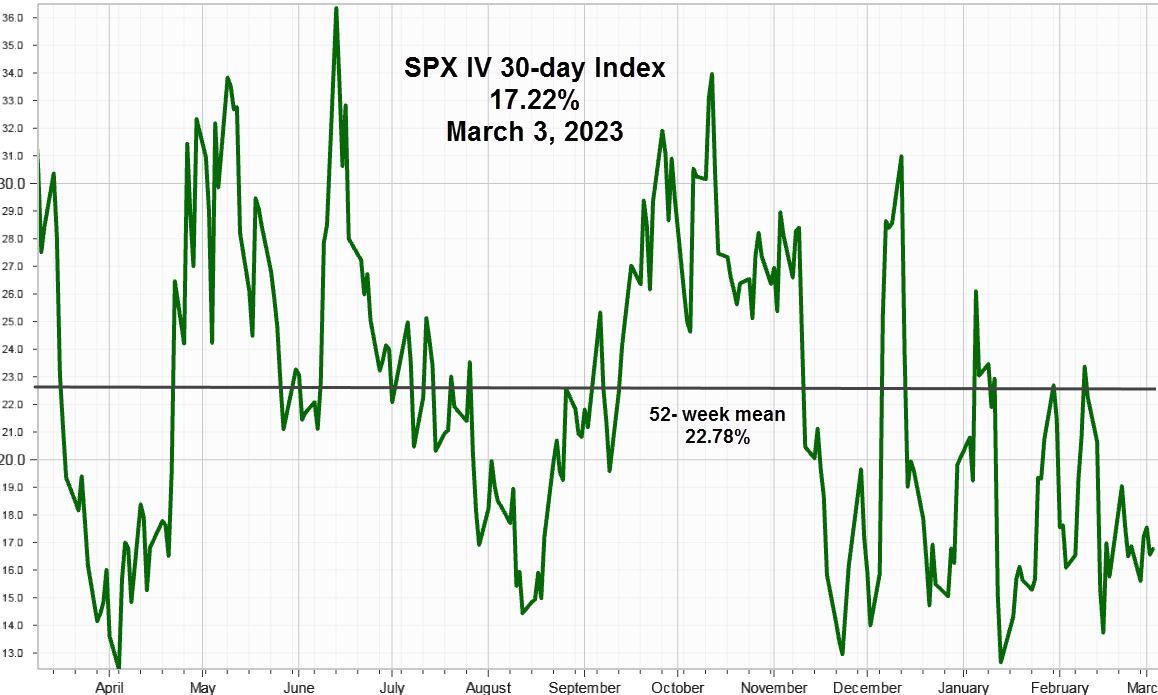
For reference, keeping in mind the tendency to return to the mean, this 52-week chart shows the IVX reading at 22.78%
Over the weekend, a popular Wall Street program featured an options strategist claiming half of SPX related options volume occurred in 0-day options, or options expiring on the same day. Friday's volume numbers show 14% for at-the-money and 2 strike prices up and down. For SPY it looks similar at about 16%. One thing is for sure, the positions are not likely opened to capture time premium.
Summing Up
While the S&P 500 Index tested both the 50-day and 200-day Moving Average early in the week, rates on the U.S. 10Y Treasury Note moved higher on a seemingly constant effort by Federal Reserve officials to talk rates higher. On Friday, oversold Notes and Bonds reversed just after SPX found support on Thursday. Now the operative upward sloping trendline makes a good reference for support of higher prices, but dependent upon the direction of unstable rates.
Previous issues are located under the News tab on our website.