Last Week’s Highlights at IVolLive:
- Register HERE for our next free, live webinar that we will be hosting tomorrow at 12 Noon EST. This webinar is titled How to Use Share Screener and Stock Screener Tools to Find Actionable Option Trades.
- In this webinar, we will walk viewers though how to use our powerful stock and share screener tool to find actionable trade ideas from criteria like implied volatility, historical volatility, and options volume measures. This stock options screener will arm viewers with the power to find potential actionable trades every day the market is open.
- On Saturday, our experts gave a LIVE walkthrough and demo on the IVolLive platform, including how to trade puts, calls, and spreads as well as how to add features like stocks, charts, the Stock Monitor, and the Profit and Loss Calculator. Watch the video HERE.
- You can register for any of our upcoming LIVE webinars HERE.
- You can watch and view any of our past videos on our YouTube channel HERE.
- Register for a free IVolLive Trial HERE.
Something Broke
March 13, 2023
At the start of last week, the equity market focused on to two upside objectives after the S&P 500 Index had just bounced off two key technical support zones. That all ended Thursday on news of a run on the SVB bank. Since the Federal Funds rate hikes began, a cohort of Wall Street analysts have been saying when "something breaks" the rate hikes will end. Perhaps more problems with long duration bond portfolios will now bubble to the surface. Friday equities dropped off the shelf with all sectors ending in the red.
S&P 500 Index (SPX) 3861.59 dropped 184.05 points, or -4.55%, with most of the decline occurring on Thursday and Friday as consolidated volume picked up to 3.2 bn shares vs. a normal run rate of about 2.2 bn shares—recording a lot of running for the exit. Now, below the 200-day Moving Average, it doesn't take a lot of analysis to conclude it will quickly test the 3800-zone made last December. Then, will "buy the dippers" come to the rescue? If not, the odds greatly increase it will retest the October 14 intraday low at 3491.58.

Now well below the upward sloping trendline (USTL) and the 200-day Moving Average (red line) and while oversold, the index could get more oversold before making a bounce back up near the key moving average.
Interest Rates
On Friday, traders of Treasury Notes and Bonds along with associated ETFs, apparently assumed problems in the banking sector will slow or end further rate hikes by the Federal Reserve, jumped in – pushing the yield on the 10-Year Note down 23 basis points (bps) to 3.70, and the 2-Year Note lower by 30 bps, at 4.60. Some portion of these gains will likely be reversed today. For example, the iShares 7-10 Year Treasury Bond ETF (IEF) 97.33 opened gap higher, and then closed up 1.76 points or 1.84% on Friday.
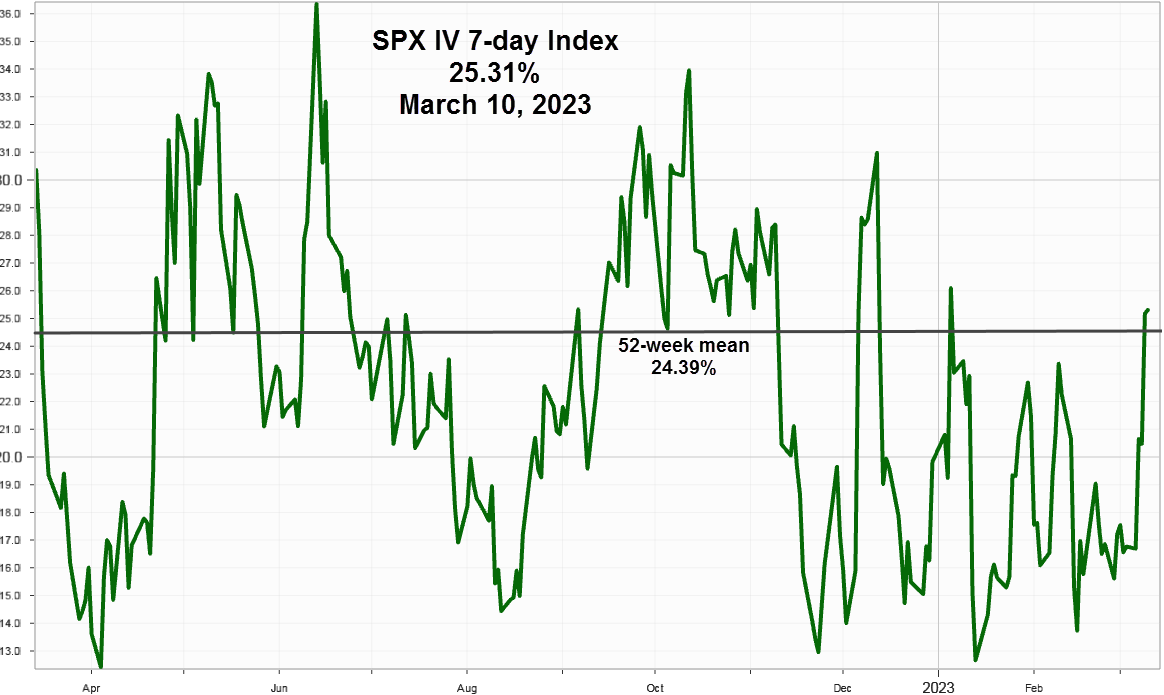
Implied Volatility
With much of the option volume taking place in the near-term it makes sense to focus more on 7-day implied volatility index.
SPX 7-day options implied volatility index, IVX gained 8.51 points to end the week at 25.31% just above the 52-week mean at 24.39%.
Friday, three days forward IVX, including the Consumer Price Index on Tuesday, for at-the-money (3860 strike) options: calls 25.92%, puts 27.01%. Both will likely open higher today.
Summing Up
After the SVB bank news last Thursday advocates of the "something will break" narrative received an unequivocal endorsement that something indeed broke from signs given in both the bond and equity markets. The narrative now swings to contagion as in how many other banks or fintech companies may follow. The odds tilt in the favor of more to come, but that dismal view could be wrong if the FDIC banking regulators quickly clean up this mess.
The S&P 500 Index appears headed for 3800 and then the October low around 3490.
Previous issues are located under the News tab on our website.