Last Week’s Highlights at IVolLive:
- Register HERE for our next free, live webinar that we will be hosting tomorrow at 12 Noon EST. This webinar is titled Part II: How to Use Stock Charts, S&P 500 Charts, VIX Charts, and other Volatility Measures to Design Options Trades.
- In this live webinar, our experts will demonstrate how to access and interpret Volatility Charts, Stock Charts, Options Charts, and other volatility charts in the IVolLive platform to design and analyze actionable, put, call, and spread trades.
- On Saturday, our experts gave a LIVE walkthrough and demo on the IVolLive platform, including how to trade puts, calls, and spreads as well as how to add features like stocks, charts, the Stock Monitor, and the Profit and Loss Calculator. Watch the video HERE.
- You can register for any of our upcoming LIVE webinars HERE.
- You can watch and view any of our past videos on our YouTube channel HERE.
- Register for a free IVolLive Trial HERE.
Duration Risk
March 20, 2023
After last week's revelations, almost everyone involved in this endeavor knows more about duration risk they may have wanted. The financial media coverage seemed good enough explaining what happen along with some dire predictions for the future in order to attract attention, as usual. Waiting for Federal Reserve Chairman Powell and the Fed funds rate decision on Wednesday, the S&P 500 Index appeared less interested in the bond market turmoil.
S&P 500 Index (SPX) 3916.64 gained 55.05 points or +1.43% last week, hovering around 3900 before closing on Friday back below the most important 200-day Moving Average at 3936.75. High combined volume all week reached a peak of 5.4 billion on Friday boosted by the expiration of monthly options and futures. From a technical perspective should the area around 3800 give way, it will likely test the October 14 intraday low at 3491.58.
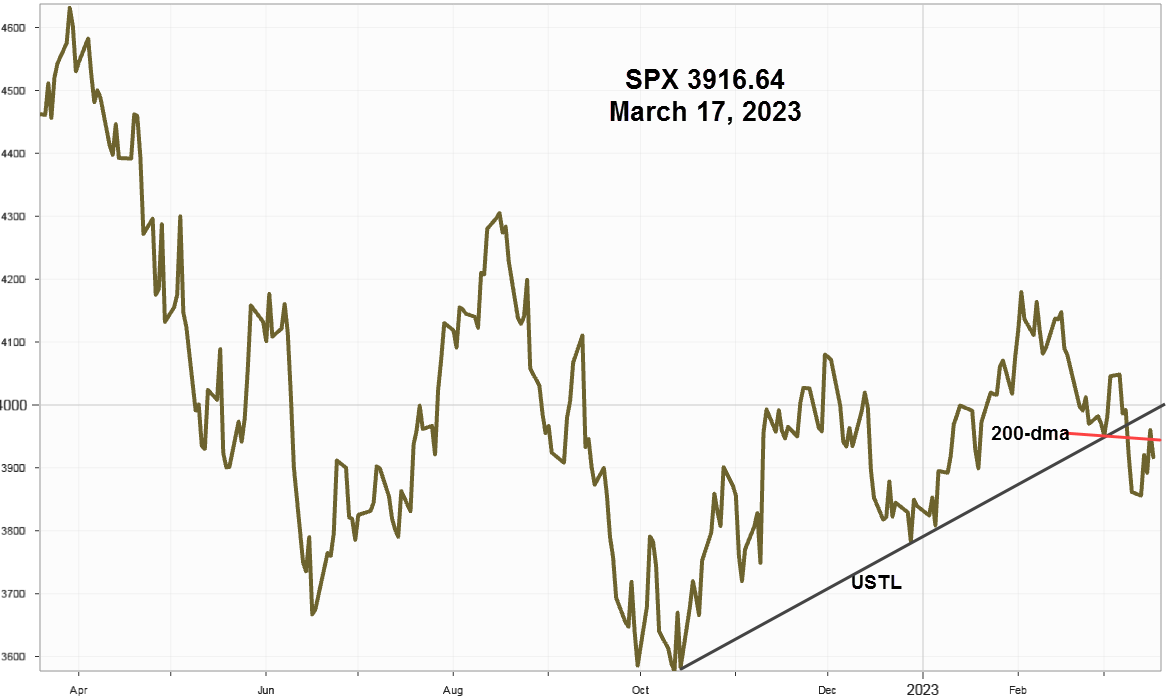
It's still well below the defining upward sloping trendline (USTL) from the October low and the 200-day Moving Average that it tested and failed on both Tuesday and Thursday. As for next Wednesday's Fed funds estimate, a 25 basis point hike leads market analysts expectations and commentary.
Implied Volatility
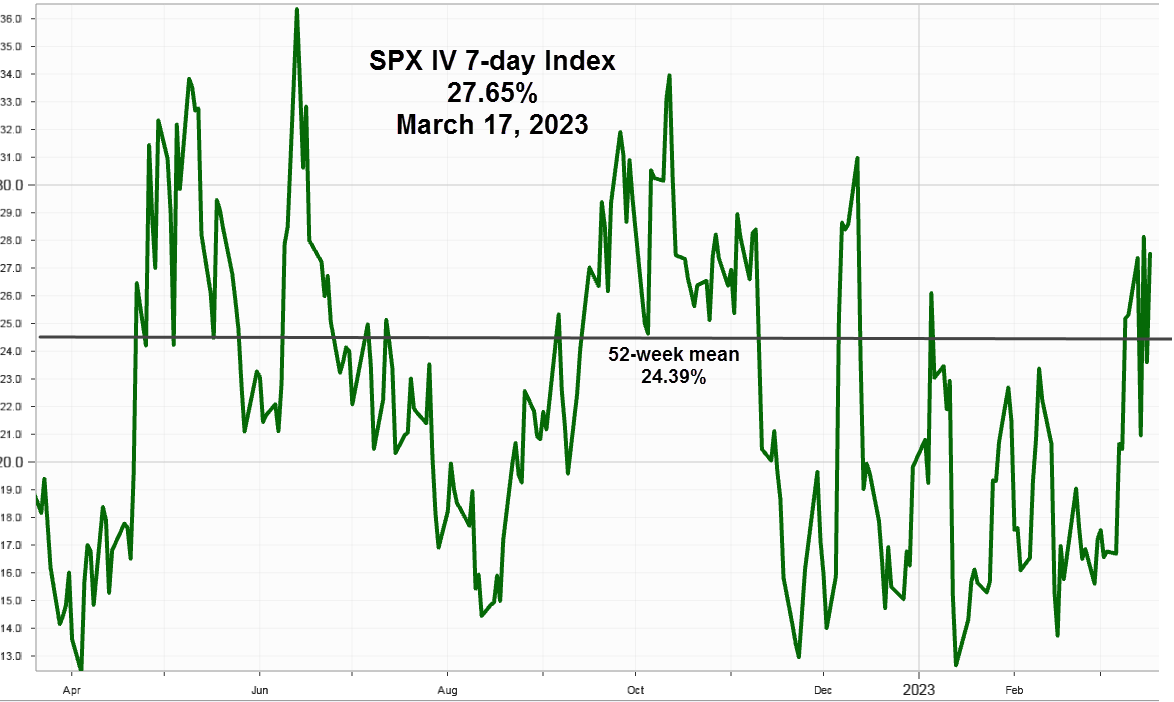
With much of the option volume taking place in the near-term it makes sense to focus more on the 7-day implied volatility index.
SPX 7-day options implied volatility index, IVX, gained 2.34 points to end the week at 27.65%, above the 52-week mean at 24.39%.
Five-day forward IVX, including Powell's commentary on Wednesday for at-the-money 3915 strike options: calls 26.60%, puts ay 29.16%. Both should be high enough on Tuesday night to consider short volatility strategies.
Gold Shines
Gold attracted safe haven interest as crude oil headed south. Central bank purchases already on the rise in 2022 in an effort to reduce reliance on the U.S. Dollar along with a rush to short-dated Treasuries by uninsured cash deposits from banks, likely accounts for a good bit of the recent enthusiasm.
VanEck Vectors Gold Miners ETF (GDX) 30.58 up 3.38 points, or +12.43%, for the week well above the 50-day Moving Average at 29.99, with Gold Spot closing at 1,989.25 up 69.73 points or, +3.63%, on Friday.
Summing Up
Long duration bank bond portfolios get tagged with the "something will break" warning as uninsured deposits moved into alternatives including short- term Treasuries with the yield on the 90-day bill declining 49 basis points (bps) to 4.52% and the 2-year Note dropping 79 bps to 3.81% for the week. Yes, that's right—79 basis points. The Federal Reserve, Federal Deposits Insurance Corporation, FDIC and the Treasury department should move quickly to calm the markets.
If the S&P 500 Index fails to hold 3800 then expect a test of the October low around 3490.
Previous issues are located under the News tab on our website.