Last Week’s Highlights at IVolLive:
- Don't forget to register for our next live webinar on Tuesday, July 11th 2023 Webinar Topic: Options Profit and Loss Calculator on IVolLive HERE
- Get a free IVolLive Trial HERE.
Time for a Midyear Checkup...
July 06, 2023


What's Happening Now in the Markets
What a change a year makes...
This time last year, the first six months of 2022 marked the worst start to a year for U.S. stocks since 1970... more than 50 years.
Fast forward to today...
In the first six months of 2023, the Nasdaq is having the best start to the year since the early 1980s. For perspective, on the heels of this resurgent market, Elon Musk and Mark Zuckerberg have added $97 and $59 billion, respectively, to their net worths in the first half of 2023 alone.
Speaking of Musk, Tesla (which we've featured in these pages a few times over the past month or so), continues to rise higher on positive news. The latest? 100,00 EV's shipped from China last month - a 20% gain:
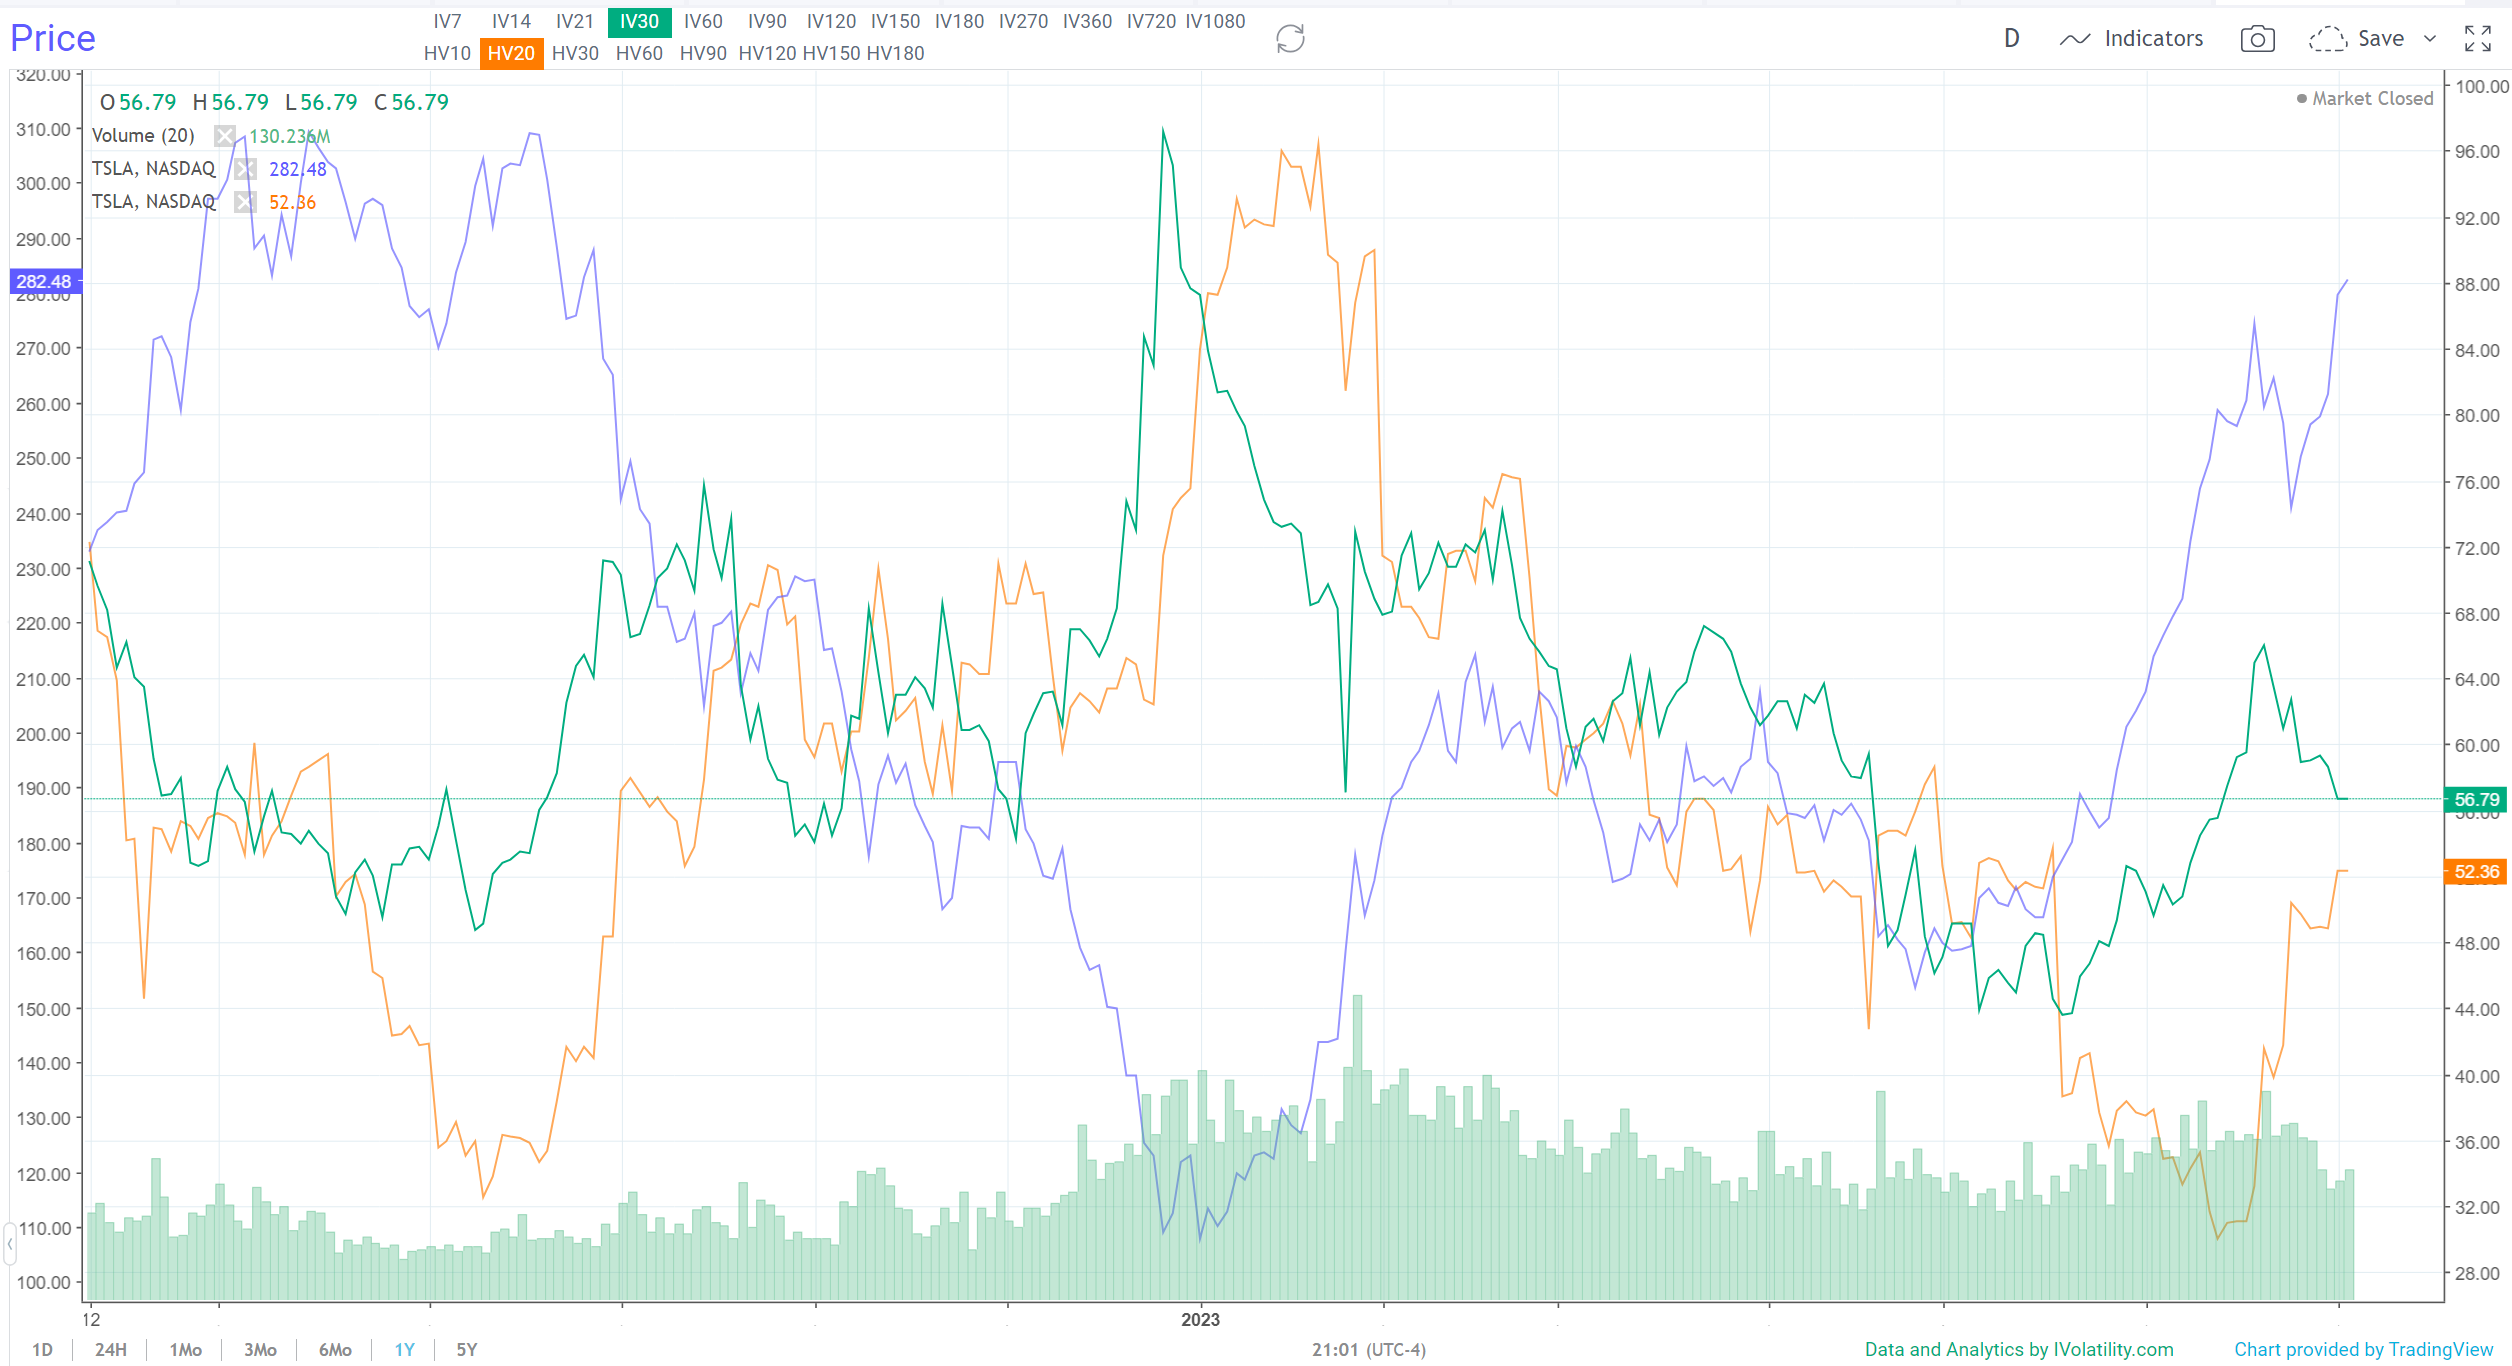
This chart from IVolLive is excellent because it shows the clear relationship between price (blue line) and implied volatility (green line). What will be interesting from this point is two things:
First, if historical and implied volatility meet, or "kiss". This will create potential reversion to the mean trades if the relationship between IV and HV gets out of whack.
And secondly, check out this chart of Tesla's Implied Volatility measured against Bollinger Bands and its RSI:
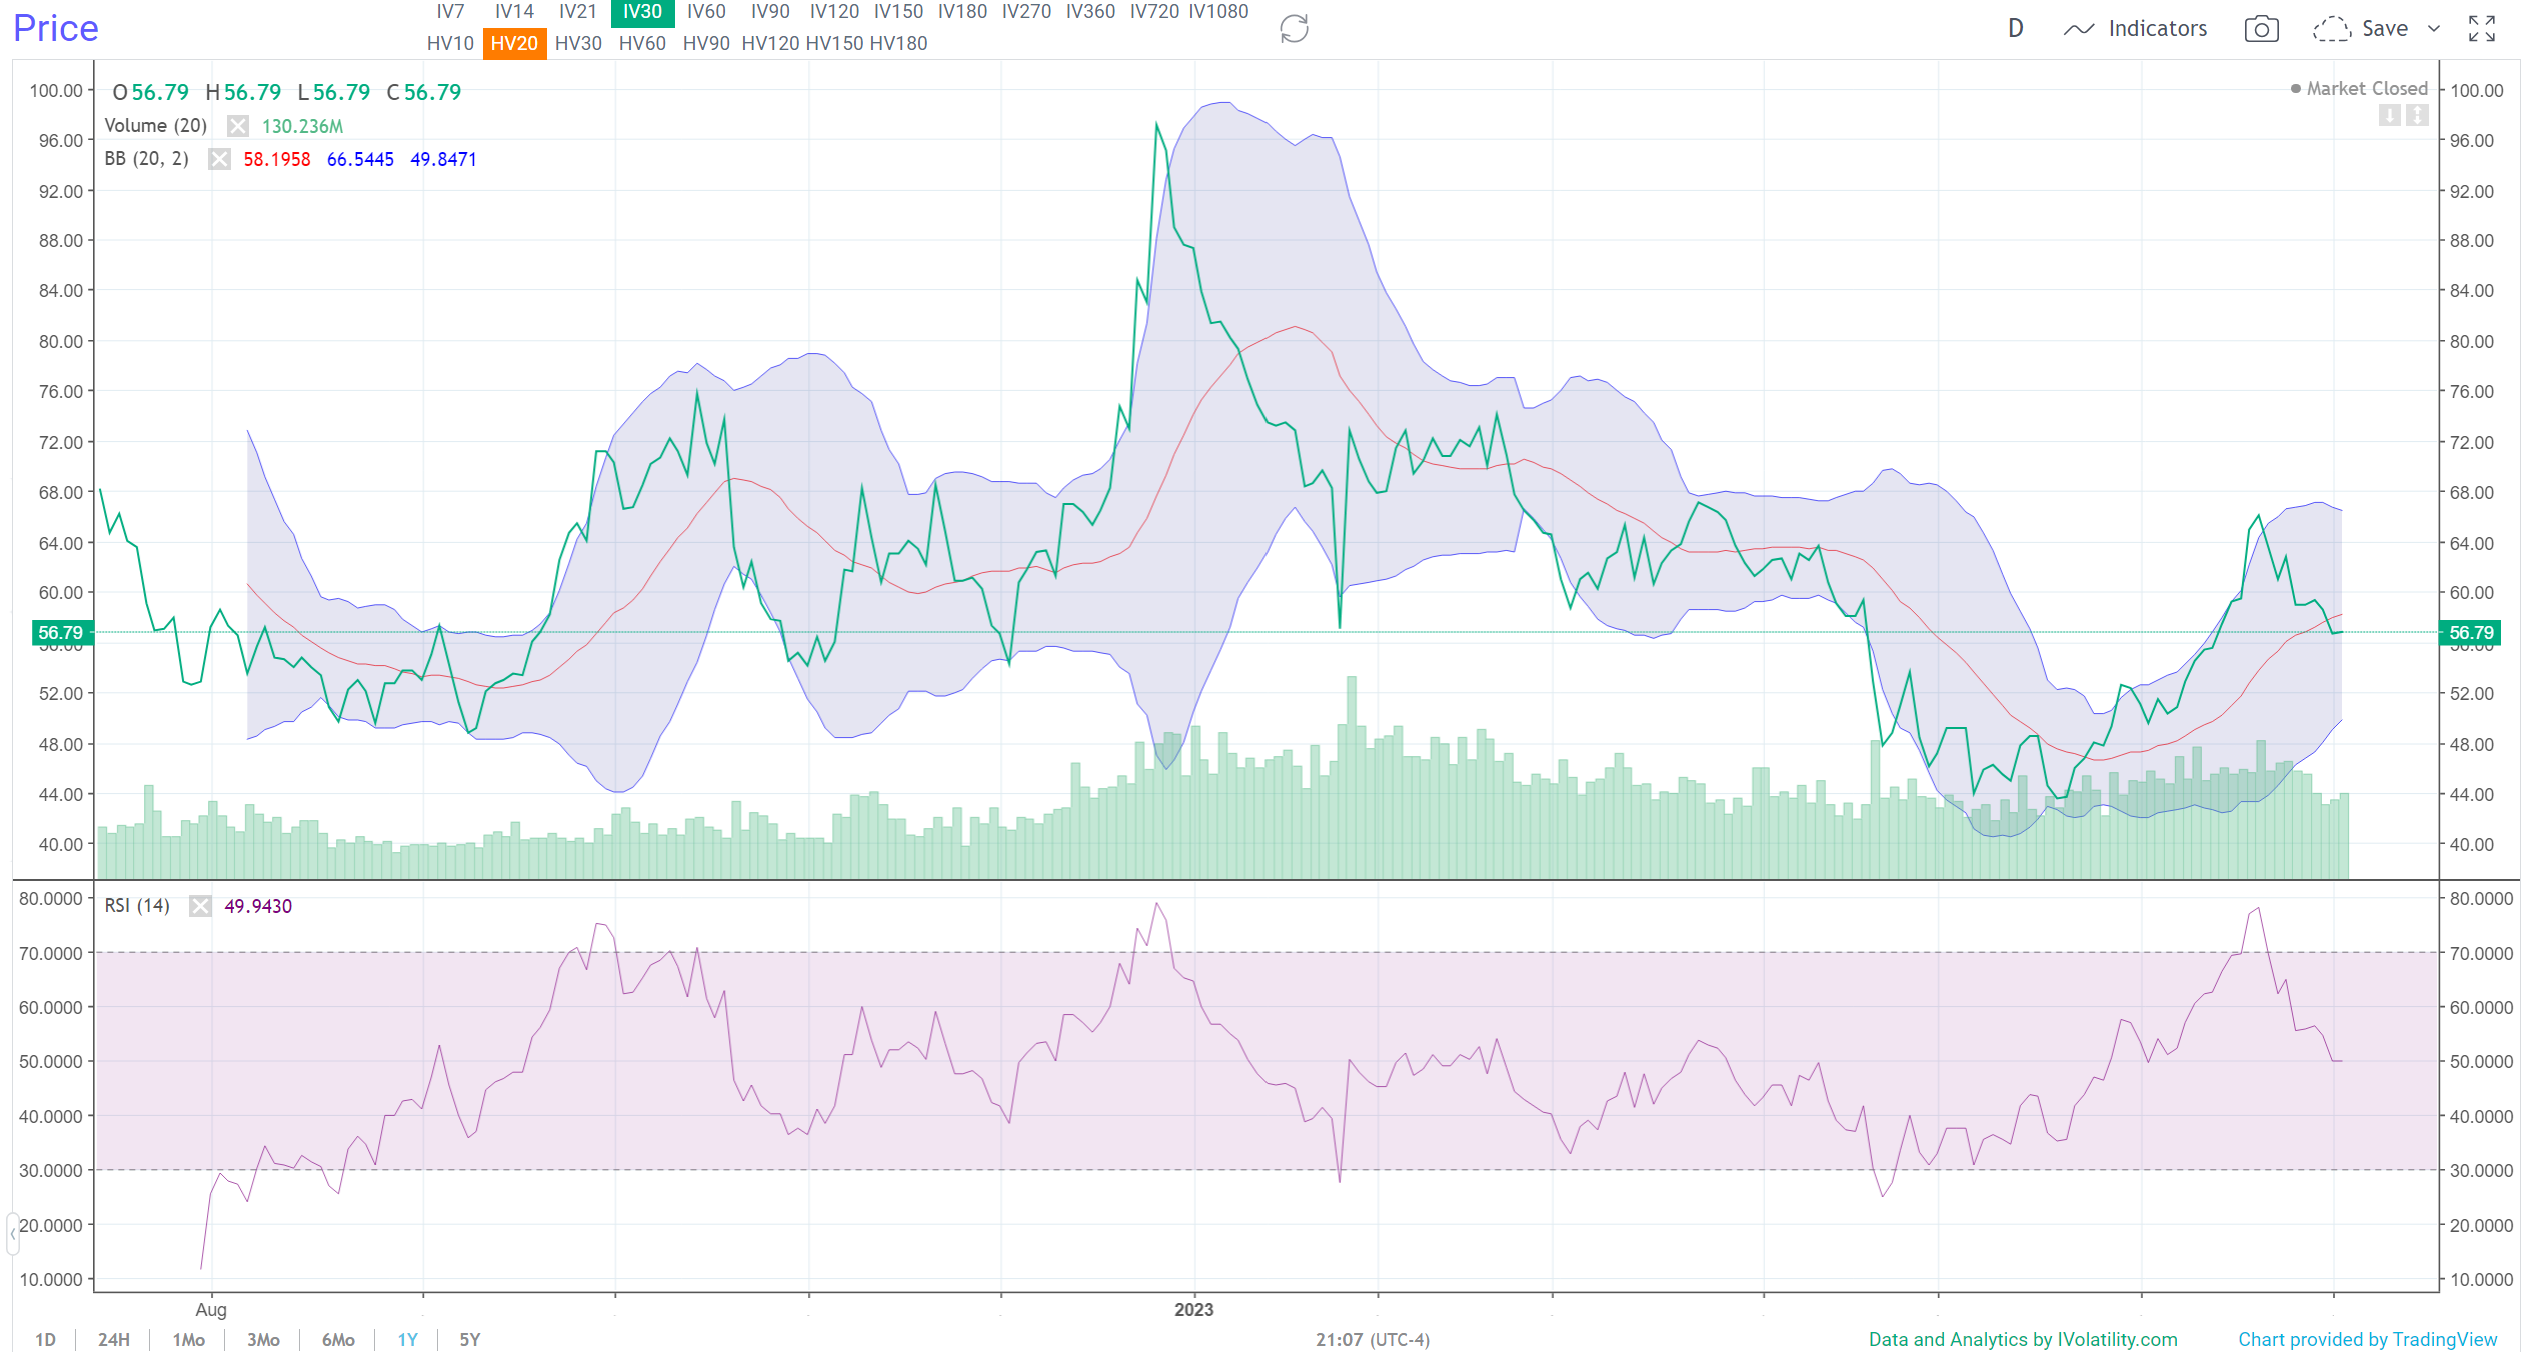
Both of these indicators are "middle of the road". This means the current trend (up) could continue for a while longer. Translation: we could look for opportunities to go long.
Now, when IV goes above its upper Bollinger band or a reading of 70 on the RSI, this will be our signal that Tesla's price could be ready to turn lower (again, remember the inverse relationship).
Conversely, when the Bollinger Bands and RSI dip below these indicators, that will be a signal that price action can continue higher.
Keep your eye on Tesla. And when you find a trade you're interested in, be sure to run it through the IVolLive Profit and Loss Calculator.
(Remember, register for the IVolLive PnL Calculator webinar next Tuesday HERE.).
How to Play It
With the VIX still so low (14.2 as of yesterday's market close), option prices are cheap. This means it's inexpensive to go long options on names you like (Tesla?).
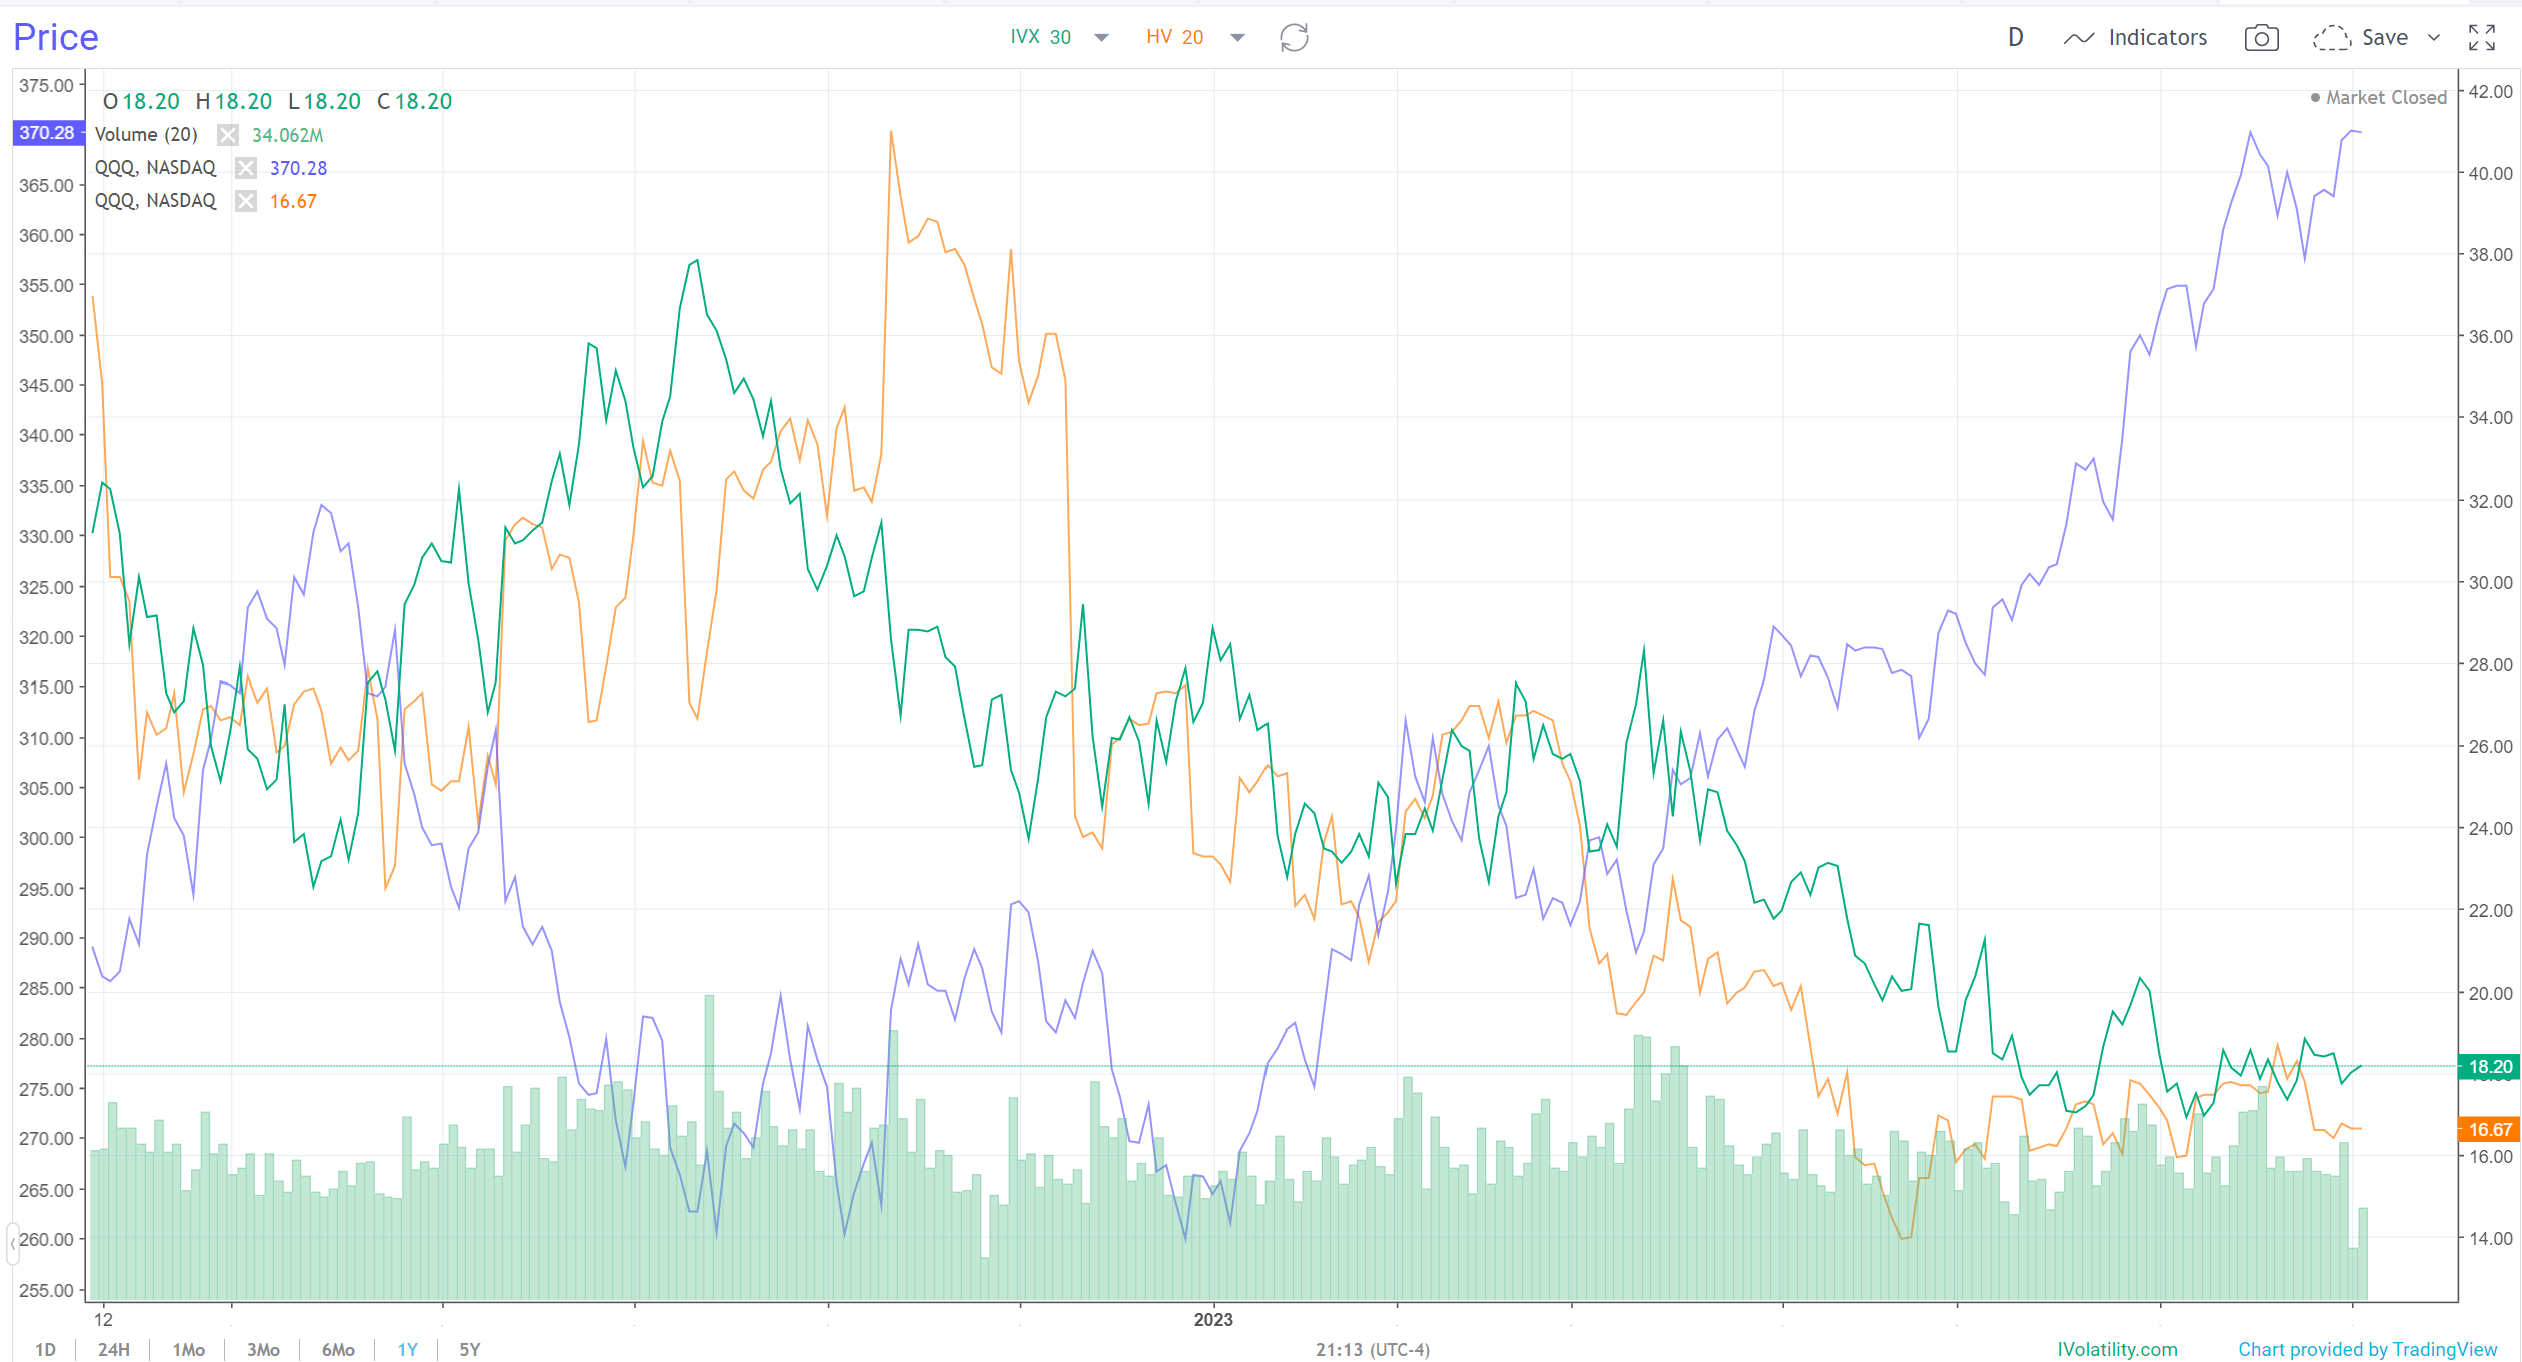
Also, check out tech. After a strong start to 2023, the trend is tech's friend. And with that, we'll leave you with an IVolLive chart of the Nasdaq ETF (QQQ):
Previous issues are located under the News tab on our website.