Last Week’s Highlights at IVolLive:
- Don't forget to register for our next live webinar on Tuesday, August 8th 2023 Webinar Topic: How to Add, View, and Use Price, Volatility, and Implied Volatility Charts to Create Options Trades HERE
- Get a free IVolLive Trial HERE.
Trillion Dollar Tech...
August 3, 2023
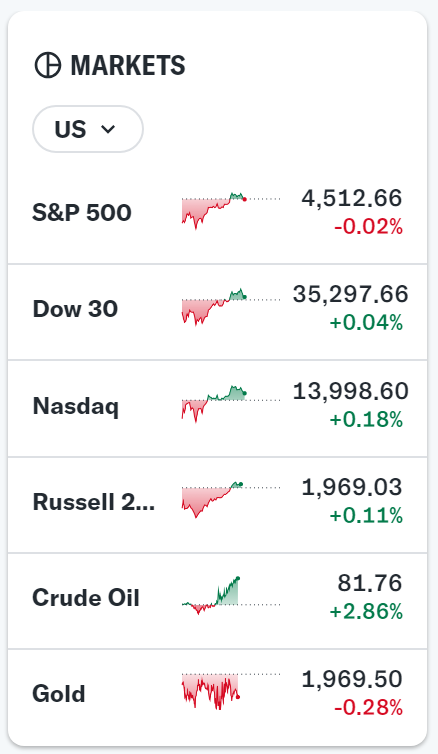
What's Happening Now in the Markets
In the history of the stock market, there's been only a handful of companies to achieve the coveted trillion-market cap:
1. Apple (AAPL)
2. Microsoft (MSFT)
3. Saudi Aramco
4. Alphabet (GOOG)
5. Amazon (AMZN)
6. NVIDIA (NVDA)
7. Tesla (TSLA)
8. Meta/Facebook (META)
Notice any commonalities in the list above? With the exception of Aramco (the largest oil company in the world), it's dominated by tech companies.
With global audiences, these companies can scale to these massive valuations. Now, an interesting point to note is that after achieving 12 zeros, Tesla and Meta have since fallen out of the trillion-dollar club.
So, the question becomes: will these two companies continue their descent, or will they rebound and re-achieve trillion-dollar status?
Fortunately, we have the ultimate "market compass" at our fingertips with the IVolLive platform.
Using the Charts in the program (which we demonstrated in depth on Tuesday HERE), we can forecast the movements for Tesla and Meta. First up, Tesla:
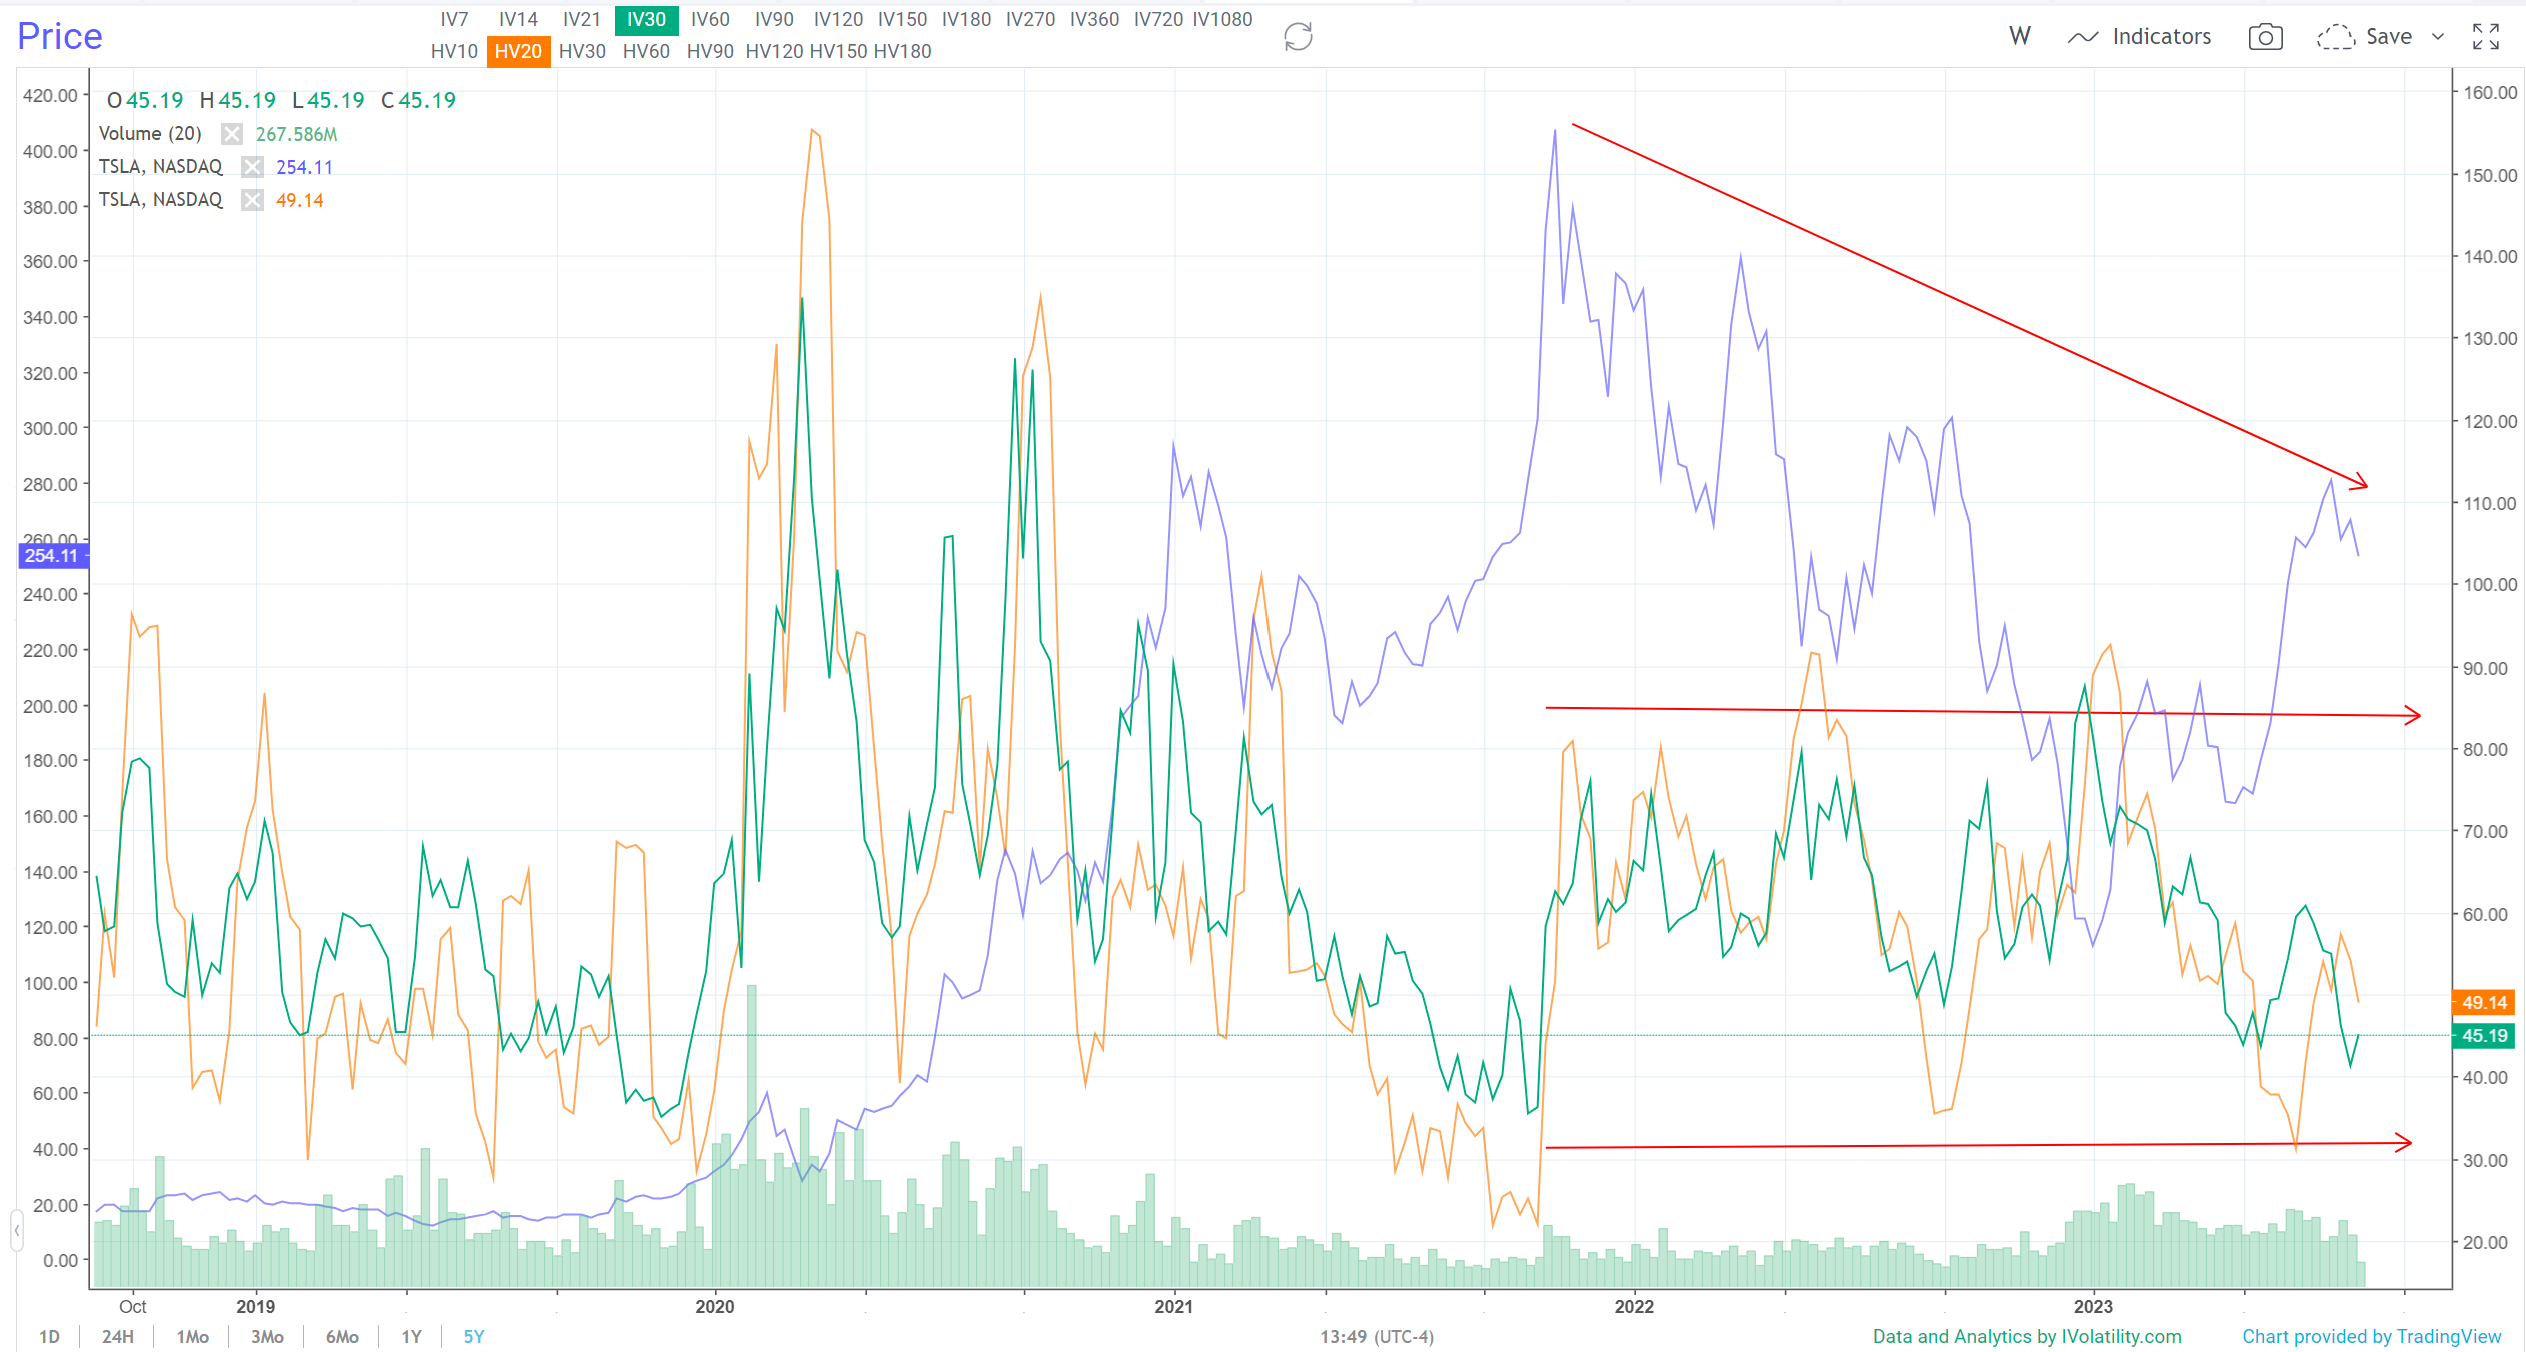
This is a five-year chart of Tesla. You can see the price peak in blue from summer 2021, then a steady downtrend with intermittent spikes up through present day.
In order for Tesla to re-achieve trillion-dollar status, it will need to break above that descending red arrow and continue higher.
At the same time, Tesla's Implied Volatility has been range bound since 2022. As you can also see, there is an inverse relationship between Tesla's share price and its IV. As one moves up the other falls, and vice versa.
Now, to predict shorter term movements, we like to zoom in on the three month chart, and apply momentum-oriented technical indicators like Bollinger Bands and RSI. Here are those two applied to the Tesla chart:
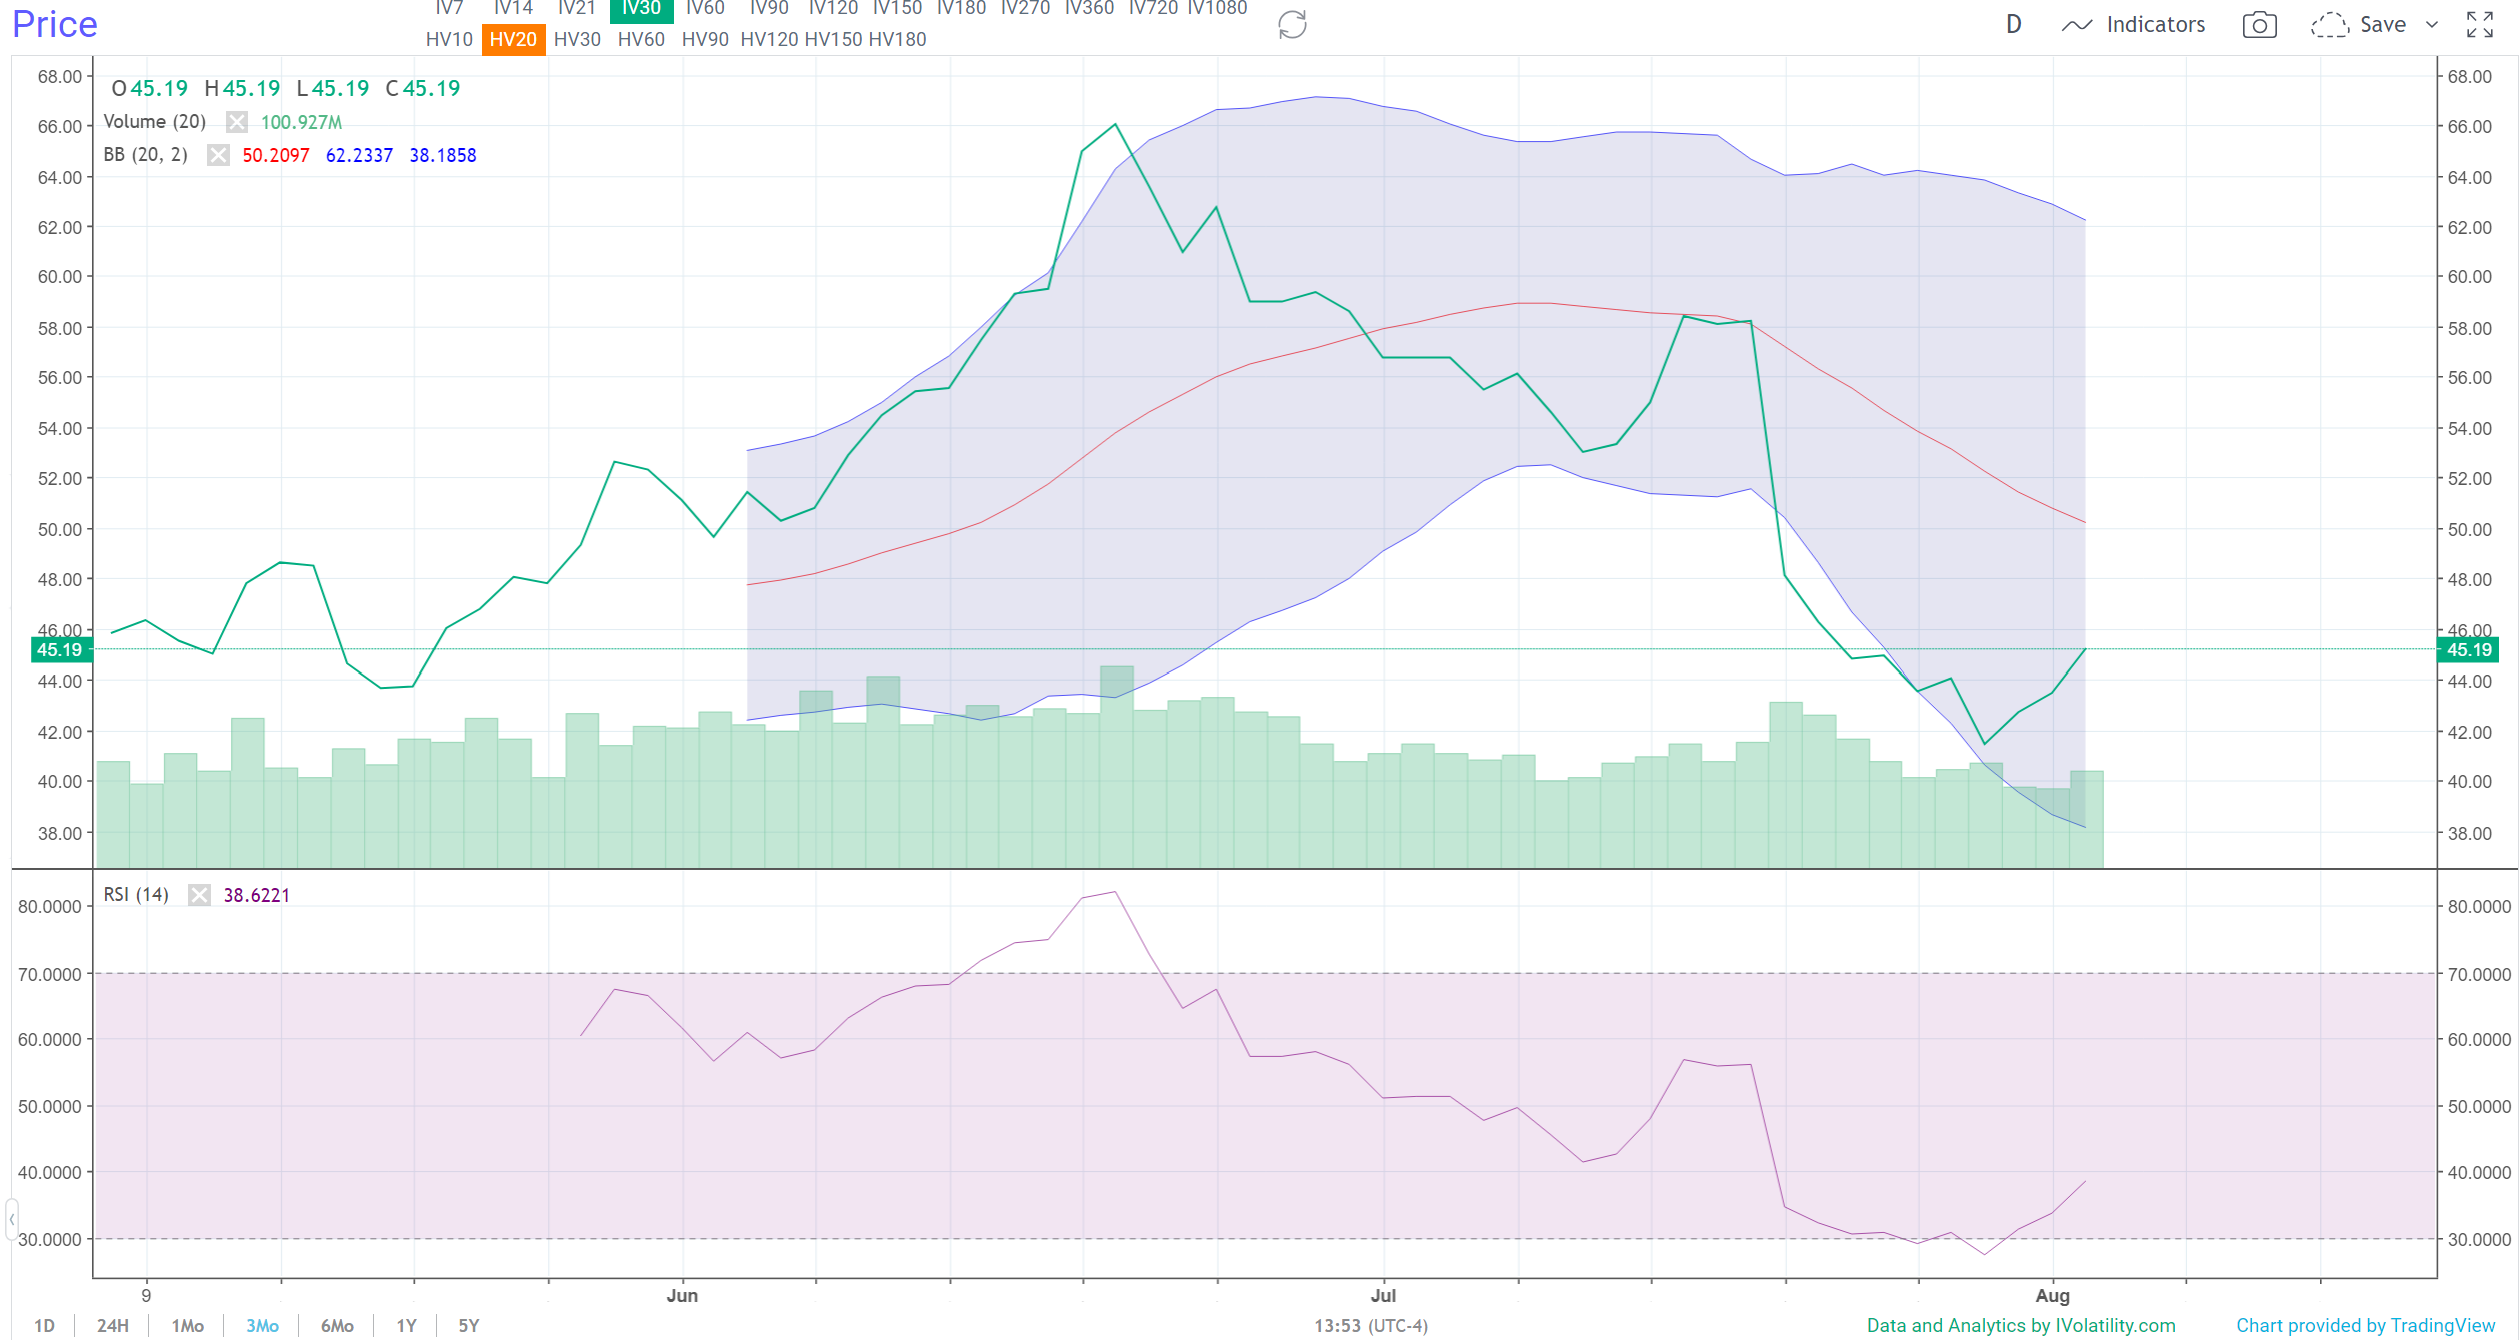
As you can see, we've isolated Tesla's implied volatility and applied technical analysis from the charting view in IVolLive. These indicators are hovering near lows... which means IV is not likely to go much lower. This means as IV bounces and rises, this usually corresponds to a lower share price.
Therefore, in the short term, we would be mildly bearish to neutral on Tesla.
It's that simple... and powerful. Using Charts within IVolLive is like having your own market compass.
Now, as a bit of a "homework exercise", try the same analysis and charting views on Meta. Using the same methodology, we used for Tesla above, what's your take?
Write to us at sales@ivolatility.com and let us know your analysis ~
How to Play It
Tech has led to plenty of interesting trading ideas this year. This idea of playing the continued fall or bounce of former trillion-dollar tech titans is one that could yield many trading - and potential profit opportunities - for the second half of the year.
Previous issues are located under the News tab on our website.