The Markets at a Glance
January 19, 2024
The S&P 500 (SPY) at a Glance
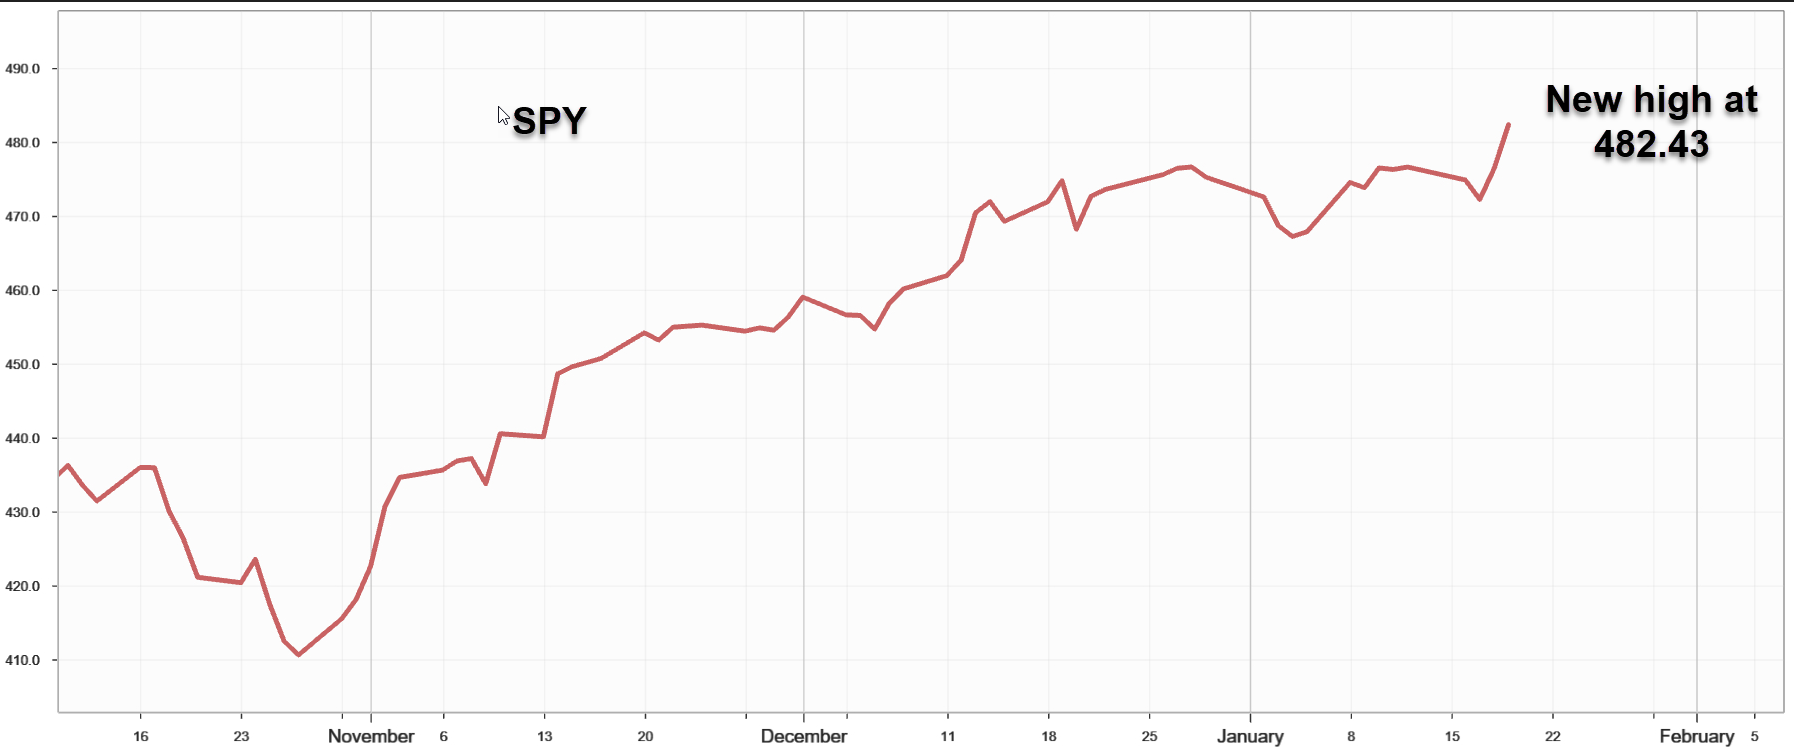
SPY showed its hand on Friday, finishing the week at a new high of 482.43. This is significant to short-term trading as new highs tend to produce some follow-up momentum in the same direction over the near term. The double top of late December and early January raised the question about whether the ETF could muster enough upward strength to set a new high or whether it would pull back. The new high essentially keeps the uptrend intact from last October.
That is important to market technicians as well as those who see January as an early indication of how the year may go. With the geopolitical situation still smoldering, and the primaries beginning to set the stage for a contentious US election, the road is likely to be bumpy. But despite the lingering inverted yield curve (which could still portend some kind of recession), investors seem to be somewhat confident that earnings are holding up, employment is holding up, inflation remains under control (even if still above target), and several potential rate cuts still loom on the horizon as a possibility later in the year.
All of this would argue for modestly bullish strategies such as bull or diagonal spreads. Covered calls and put writes can also be appropriate, though premiums overall are low, as can be seen below.
Option Volatility on SPY at a Glance
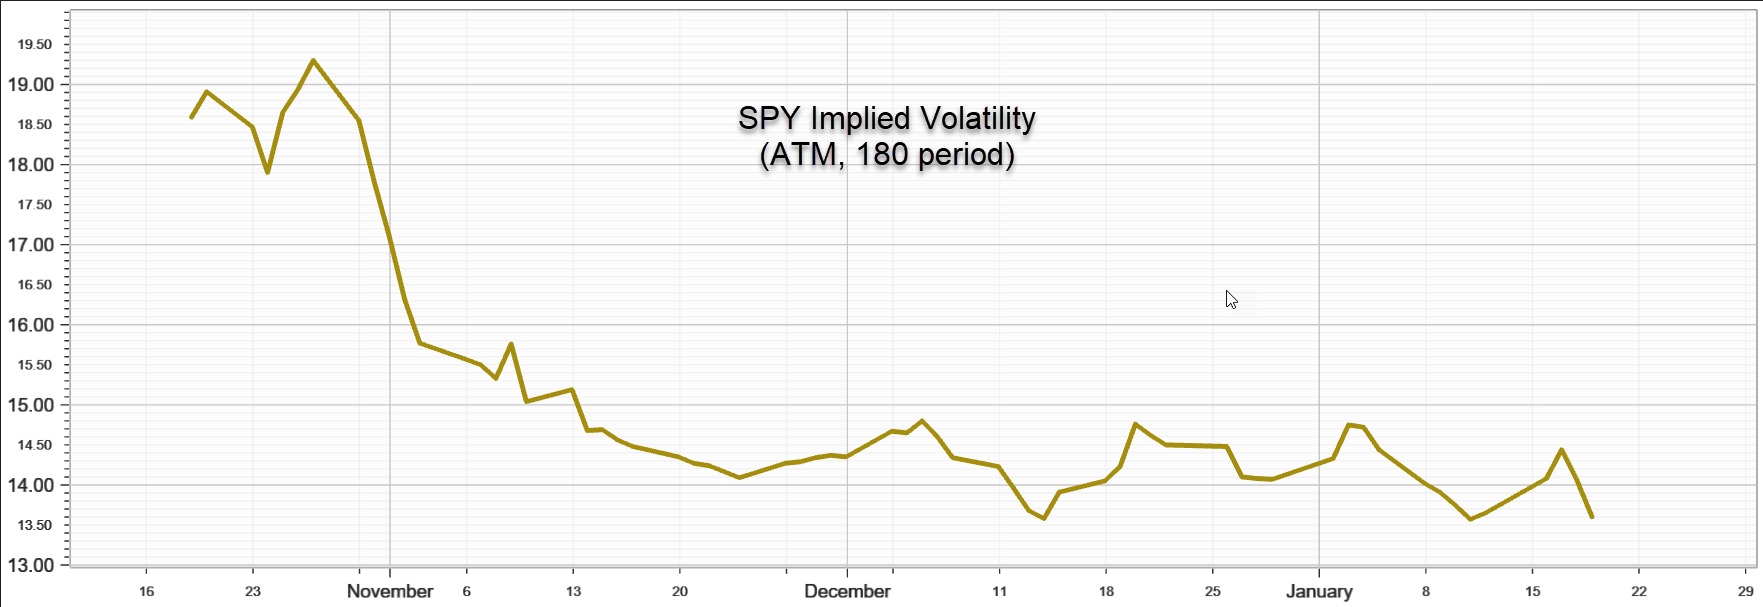
As the SPY rose to a new high, its implied volatility confirmed the advance by sinking back below 14. The hourly movements on the VIX show a seesaw action during the week as VIX threatened to start rising, and did get above 14, but then fell back below. The December low was 12.07, but VIX has thus far ranged between 12.5 and a high of 14.79 in January.
The takeaway on volatility for me is that it appears to have very little room left to decline and will more likely rise from here with any pullbacks in the underlying index. That means strategies that are long volatility (i.e. long in-the-money calls, diagonal spreads, and even straddles) could be worthy of consideration here. That, of course, is based on the low volatility of the SPY and may not necessarily carry over to other ETFs or individual stocks.
Things to watch
• The bitcoin miners (MARA, RIOT, HUT, HIVE) continue to have substantial near-term premiums, but they are also still selling off as people who bought strictly to make money on the bitcoin ETF trade close out their positions. There is no telling when the miners will recover, if at all. Now that there are bitcoin ETFs, there may be much fewer people who play bitcoin through mining stocks. To capture the excess short term implied volatility (a volatility 'skew'), you would need to buy a longer-term straddle and then sell a shorter-term straddle or strangle, rather than doing a covered call or put write, at least until your confident the selling has abated.
• Tech stocks also gained new strength, causing XLF to reach a new high at 200.17. But while the broad tech index hit that new high, many individual players have not. Cathie Wood's ARK Innovation ETF (ARKK) is down 15% from its December high at 46.32. An ATM covered call write for one week, for example, using the 46.5 strike, would return 2.1% if assigned; and the 4-week call write using the 47 strike would return 5.1% if assigned. Those are both considerably over 50% when annualized. Leveraging up with ITM calls instead of stock could potentially return a good bit more, as could using higher strike prices.
Strategy tip: Naked puts vs. Covered Call Writes
Whenever I mention covered call writes, you should remind yourself that the same risk/reward can be achieved with a put write at the same strike and expiration. In the example above, instead of buying ARKK stock and selling a Feb 67 call, you can consider the sale of a Feb 67 put to represent the same strategy from a profit/loss perspective, as long as there is no dividend.
A lot of people ignore naked put writing or perceive it as riskier than a covered write, without realizing that it is not only the same strategy as covered call writing from a risk/reward standpoint, but it has a couple of advantages. For one, you put up only 20% of the stock price for a naked put, so you have 5X as much leverage as when you purchase the stock, and more even when you purchase the stock on margin. In addition, you can do a naked put write without setting up a debit balance and paying margin interest.
The advantage that covered calls have over naked puts are dividends, if there are any, and the ability to hold a stock long enough to qualify for long term capital gains.
Previous issues are located under the News tab on our website.