The Beauty of the Butterfly
February 22, 2024
The Markets at a Glance
SPY vs. QQQ
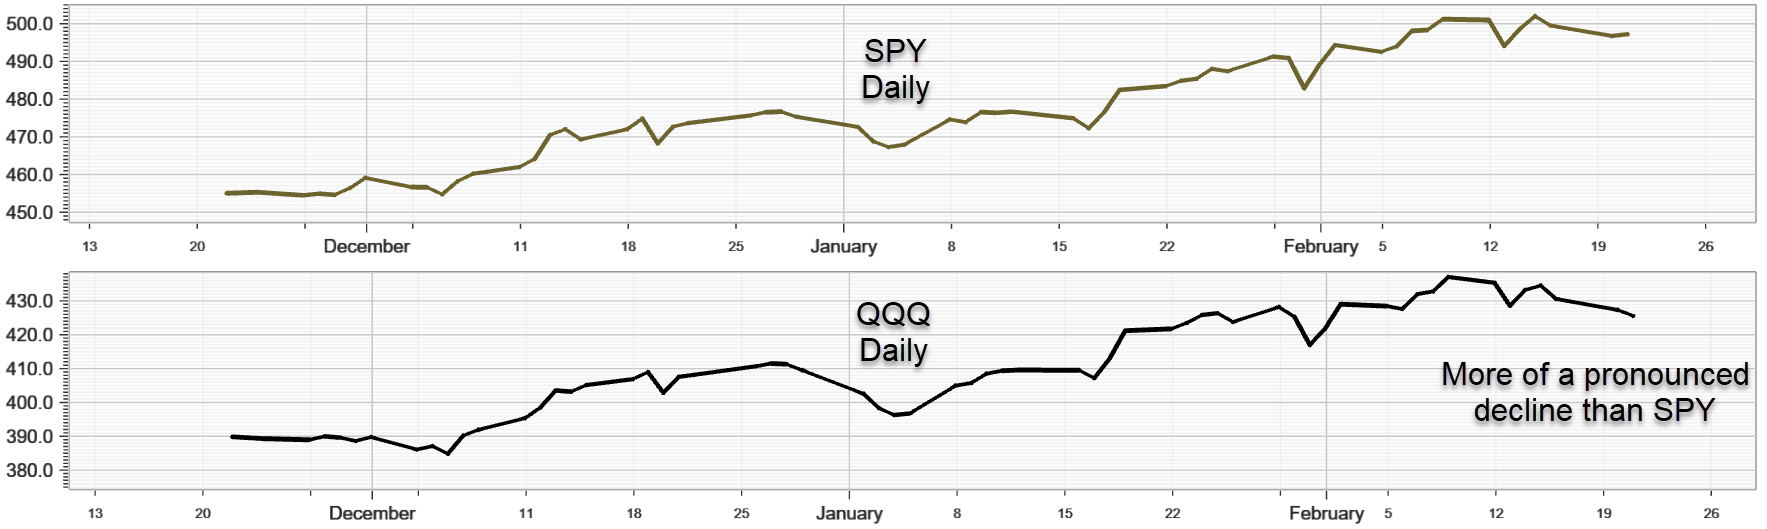
While SPY and QQQ are highly correlated, comparing the two can sometimes provide info that one chart alone might not offer, especially when a change of trend might be brewing. During the last week, SPY flattened but remains in its uptrend. On the other hand, QQQ showed a slightly more pronounced decline. While this could turn out to be nothing more than a broadening of the rally into other sectors, it could also suggest that the tech sector is starting to change trend and as the leading sector for the market's advance over the last several months, that's a yellow caution flag on near-term performance.
Thursday morning update: NVDA reported very good earnings again and is up 15% in early trading, giving new life to QQQ and the tech sector. Personally, however, I think the momentum on the tech rally is waning somewhat and this could be a temporary reaction to the upside rather than a return to the uptrend. The rest of this week should be watched closely to see if there is follow through to the upside.
Option Volatility ($VIX)
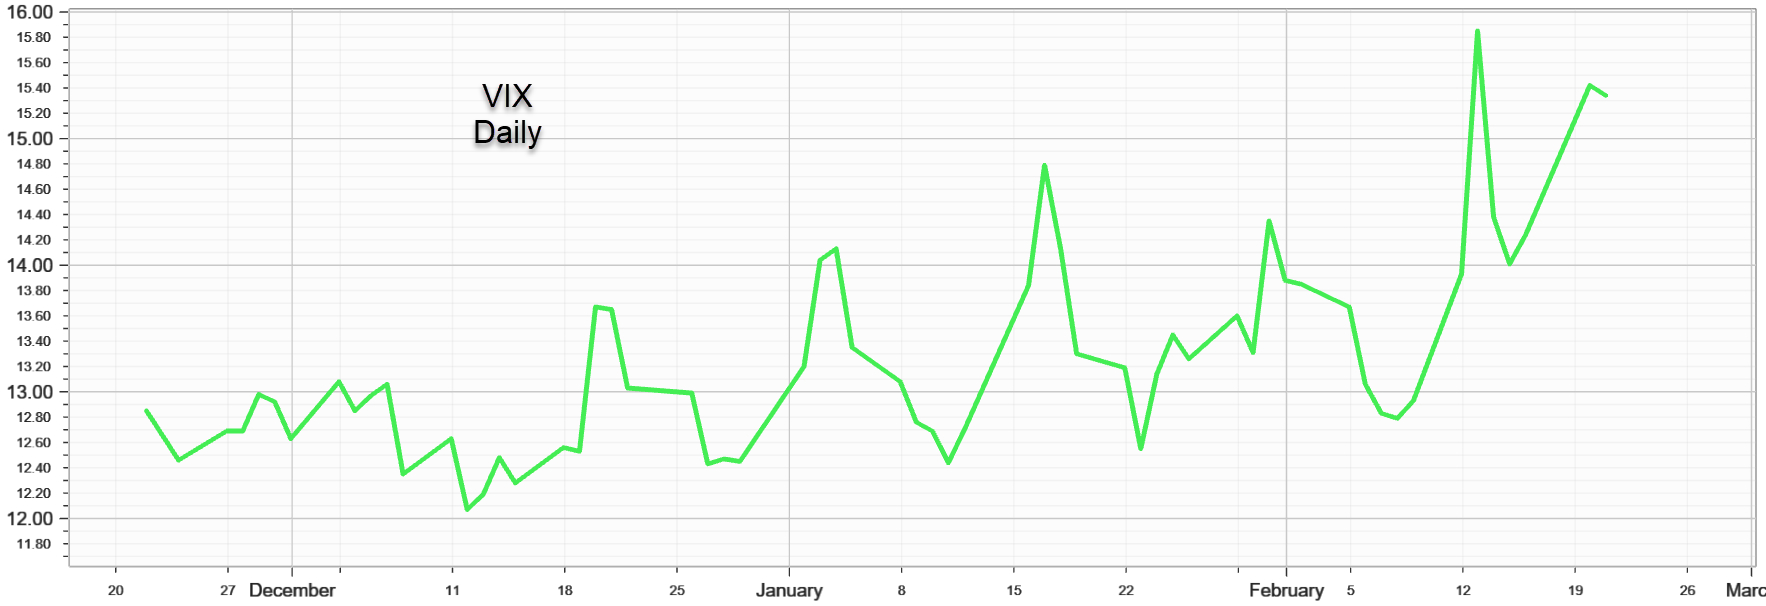
VIX is continuing its seesaw movement but with successively higher peaks and an overall trend that is now unmistakenly upward. Keep in mind that this has been happening even as the uptrend in the SPY and QQQ continues and as new highs have occurred. This suggests some momentum building slowly in implied volatility as the market potentially peaks and begins to roll over.
From an options perspective, I interpret this to mean that long stocks or long calls are losing attractiveness by themselves here and that the higher implied volatility is looking better for covered call strategies and spreads. In addition, hedged strategies on downside movements in the market can be considered, though on individual stocks, the situation is still quite mixed do they should be looked at individually to determine possible direction.
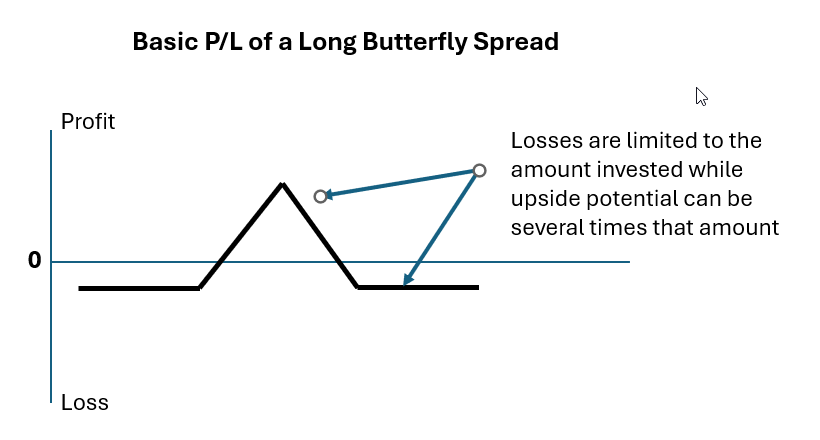
Strategy tip: The (Underappreciated) Beauty of the Butterfly
There was a time when the butterfly spread was a strategy that looked good on paper but was totally impractical due to high commissions. Now that commissions are much more reasonable, it has become one of my regular strategies (in small quantities). In my view, its beauty lies in these advantages:
• Low cost
• Limited risk
• Very short term (1-4 days)
• The ability to salvage some value even when wrong on direction
I don't recommend butterfly spreads as a primary strategy in your portfolio, nor will it make sense to do one as a single large position. I find them to be helpful when I want to trade the short-term direction of a stock or ETF, yet can't justify other directional strategies or simply don't feel confident enough to take much risk. I can be in the game with a very small commitment by using a butterfly spread. I have also used the strategy as a cheap way to hedge a large position, a way to play the market ETFs for a one or two-day move, and a way to play a stock whose implied volatility makes other strategies undesirable.
As with most option strategies, there are numerous ways to implement butterfly spreads. One can use puts or calls, do long or short spreads, vary strikes to allow more or less upside or risk, do asymmetrical spreads or alter one side to create "broken-wing" butterflies. For now, however, let's focus on a symmetrical 1-2-1 butterfly spread with calls or puts.
As an example, If I thought GOOG was going to move up a couple more points before Friday's expiration, I could consider the following (based on Wednesday's closing prices):
Long 1 GOOG Feb23 145 call
Short 2 GOOG Feb23 147 calls
Long 1 GOOG Feb23 149 calls
(Net debit = $.31 per share plus $2 per share margin req)
The maximum value of this combo can be 2.00 at expiration. However, a big note of caution should be made here: You should never expect to make anywhere close to the maximum and should not wait until the very end of the day to unwind your position. Maximum gains rarely occur in these situations. Instead, a more reasonable goal is a quick double, assuming the stock moves toward 147 on Friday.
If the stock goes down instead, below 145, then you should change your goal to salvaging whatever you can get and closing. Even in that circumstance, you can likely get perhaps half your money back.
If you are not experienced at butterfly spreads, I suggest trying a few on paper until you find your comfort level. For a guide, my general parameters are as follows:
• Strike prices separated by 2-5 points (and equal on both 'wings')
• Time remaining: 1-4 days
• Net debit: $.20-.80 per share
• Time objective: Close prior to mid-day of expiration
(These rules are starting points. Adjust to your risk parameters.)
Take this as a quick intro to the strategy. I'll speak more about it and show more examples in future postings.
Previous issues are located under the News tab on our website.