Market Update: 2022-02-12 |
We offer multiple professional grade services to help you gain insight on volatility trading. Do not hesitate to try our products by clicking HERE |
Another weak session across major indices to conclude the week. The Nasdaq-100 was the worst performer on the day down more than 3% followed by the SPX down almost 2%. Markets continued to digest the aggressive moves in interest rates and late day headlines about a possible escalation in the Ukraine-Russia conflict reduced the willingness of traders to hold long positions going into the weekend. |
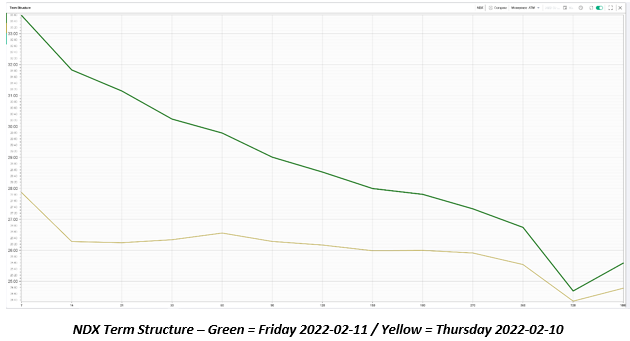
In the NDX, the curve is now fully inverted with more than 2 vols differential between weekly implied volatility and 30d IV. |
|
On the day, NDX 30d IV was up 4 points, SPX and DOW 30d IV were up 3 points. |
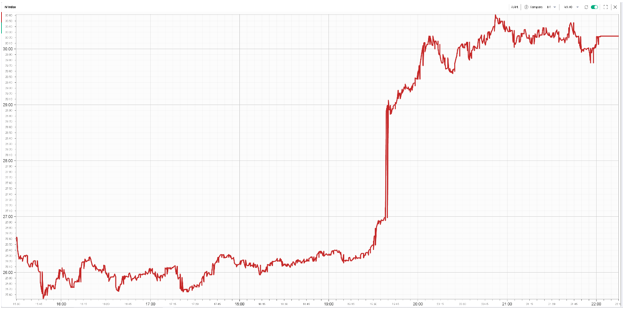
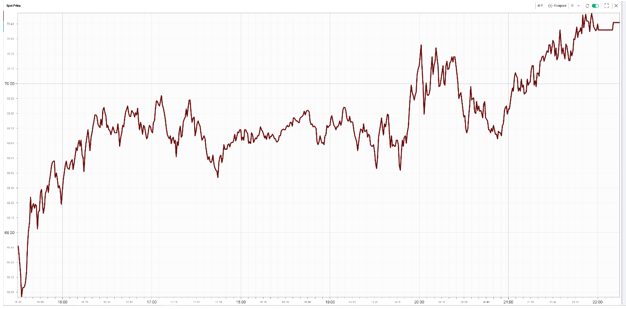
On Thursday, we flagged how AAPL implied volatility had failed to react meaningfully to the increasing worries in the market. On Friday, the overall market reaction was very different. AAPL 30d IV saw the second highest volatility remark of the entire index up more than 5 points despite being only down 2%. |
The below chart of the 30d IV of AAPL throughout Friday’s session clearly shows the rush to buy options as soon as the headlines on the Russia/Ukraine conflict broke out. |
|
One notable exception to the selloff was seen in the energy sector which remained fairly bid all day. The XLE managed to close up almost 3% as Crude gained 4.5% undoubtedly helped by geopolitical tensions in Eastern Europe. |
|
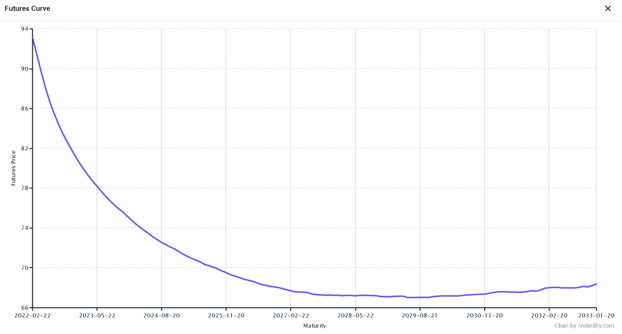
Looking at the Futures curve, it is firmly in backwardation, with a spread greater than $13 between front-month and end of year contracts, a sign that the market expects prices to normalize over the next few months. |
|
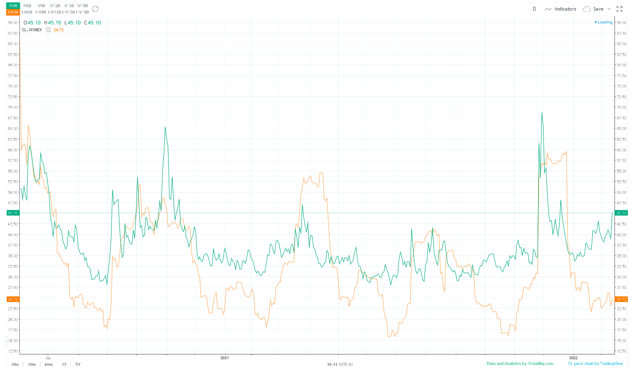
In the short run though, looking into the 30d IV of Crude Oil against the 20d realized volatility indicates that the IV premium in crude is pretty much the largest it has been over the last 12 months. |
|
In stocks, AMD was very much in focus on Friday, with spot collapsing more than 10%. 30d IV reacted very aggressively and jumped more than 10 points on the day. |
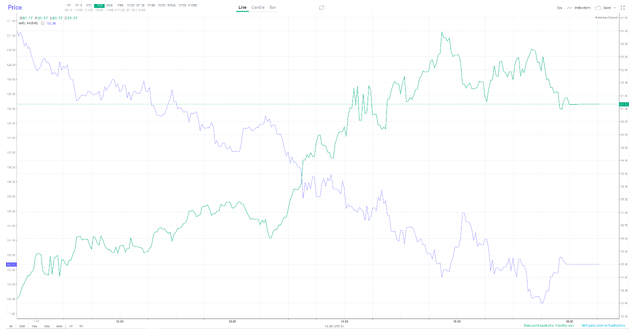
Looking at the trading session, it looked like the stock (price in purple) was steadily sold all day while IV (in green) rose throughout the day until it reached above 60 IV where it started to be more paired off even as spot continued to slide. |
|
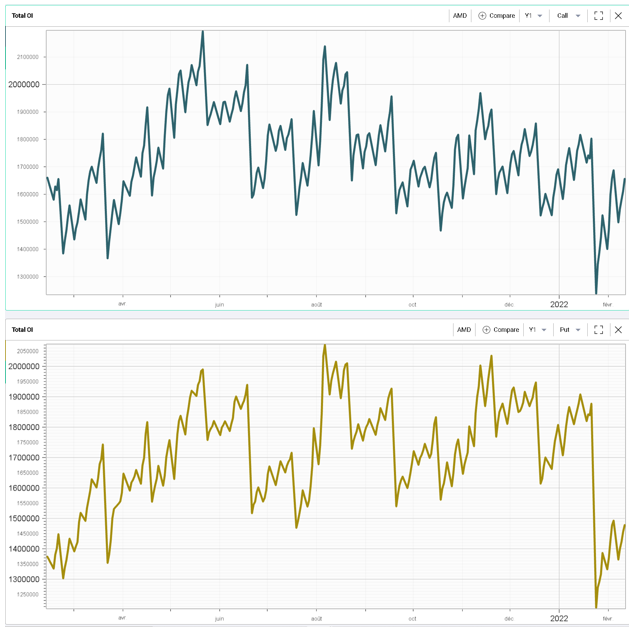
Volume in the options was impressive with 1.25 million contracts trading on the day and around 800k calls exchanged on the day. Looking at the open interest for both calls and puts does not point to any extreme situation compared to the stock’s history. |
|
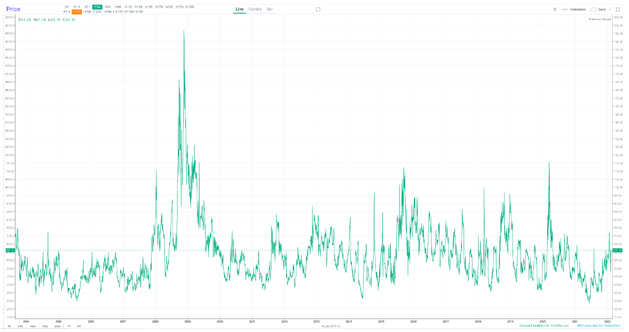
If AMD 30d IV is pretty much the most expensive it has been over the last 12 months around 61 vols, it remains relatively benign in historical context where it reached far greater levels on multiple occasions. |
|
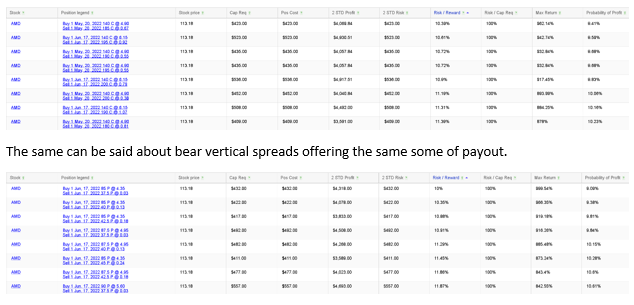
A quick look at the RT Spread Scanner shows that it is possible to find many bull vertical spreads offering a risk of around 10% compared to the potential reward. |
|
