Market News & Research June 27, 2022 Bounce Potential |
Last week Bottom Signs identified a few reasons why the odds had increased for expecting an oversold bounce and indeed that's exactly what happened as the S&P 500 Index added 236.90 points or 6.45%. More below. Like a basketball with kinetic energy due to its motion and potential energy stored in the object itself some bounce estimates should be helpful, although the analogy may lack some scientific rigor. |
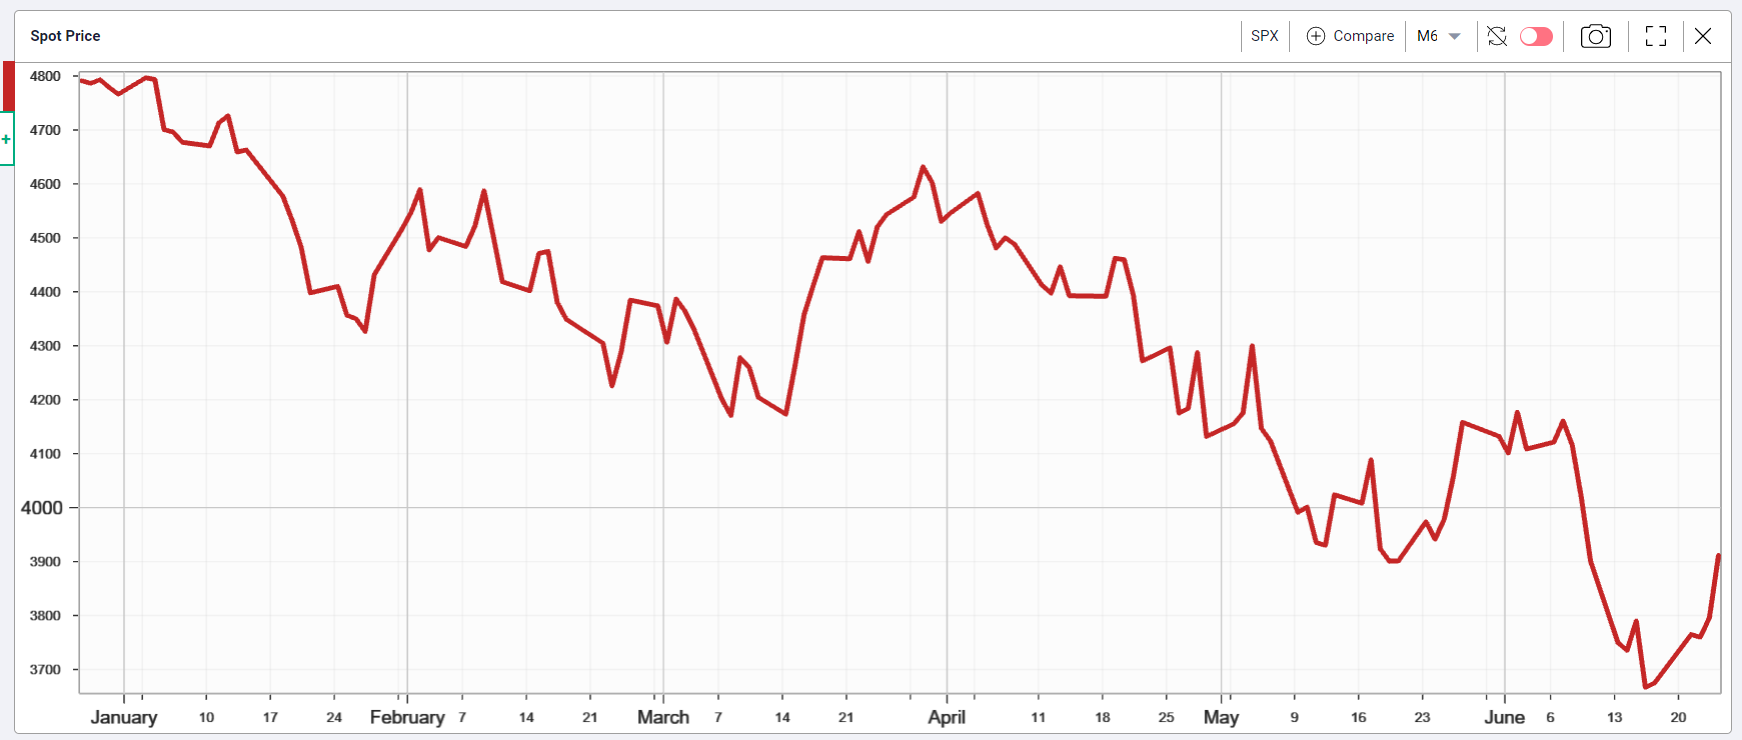
S&P 500 Index (SPX) 3911.74 up 236.90 points or +6.45% last week with almost half or 3.06% on Friday as it opened with a gap to the upside then finished with combined volume of 3.4bn shares compared to 2.5bn on Thursday. Friday closed the first open gap made on Monday June 13, called a pattern gap or gap within a pattern. Then a close back above 4017.17 would close the second gap made on June 10 on the way down and becomes the first bounce objective. |
Next, a potential higher close above Friday's 50-day Moving Average at 4065.84, but trending lower, becomes the second bounce target. At this point, should it occur, calls for buy-the-dippers would challenge sell-the-rippers. |
The third bounce target becomes the June 2 high at 4177.51 since a close above this level would challenge the downtrend that began on March 29 at 4637.30 and begin speculation that the bounce presages a turn-around and perhaps even an end to the bear market. |
Although the low made on June 17 at 3636.87 may mark the low for this bear cycle until interest rate hikes slow or decline (the U.S. 10-Year Treasury Note yield declined 12 basis points last week) it seems premature to begin speculating that the bears have finished. In addition, analysts' earnings estimates will likely come down more as second quarter reporting gets underway. Earnings don't yet fully reflect declining consumer sentiment along with the drag from the higher U.S dollar compared to both the developed and emerging markets. |
While the bounce underway has sufficient potential to continue up enough to close the open gap and even enough to close back above the 50-day Moving Average, any further advance seems less likely without some help from interest rates and earnings.The SPX chart shows last week's accelerating advance from the June 17 low at 3636.87. |
|
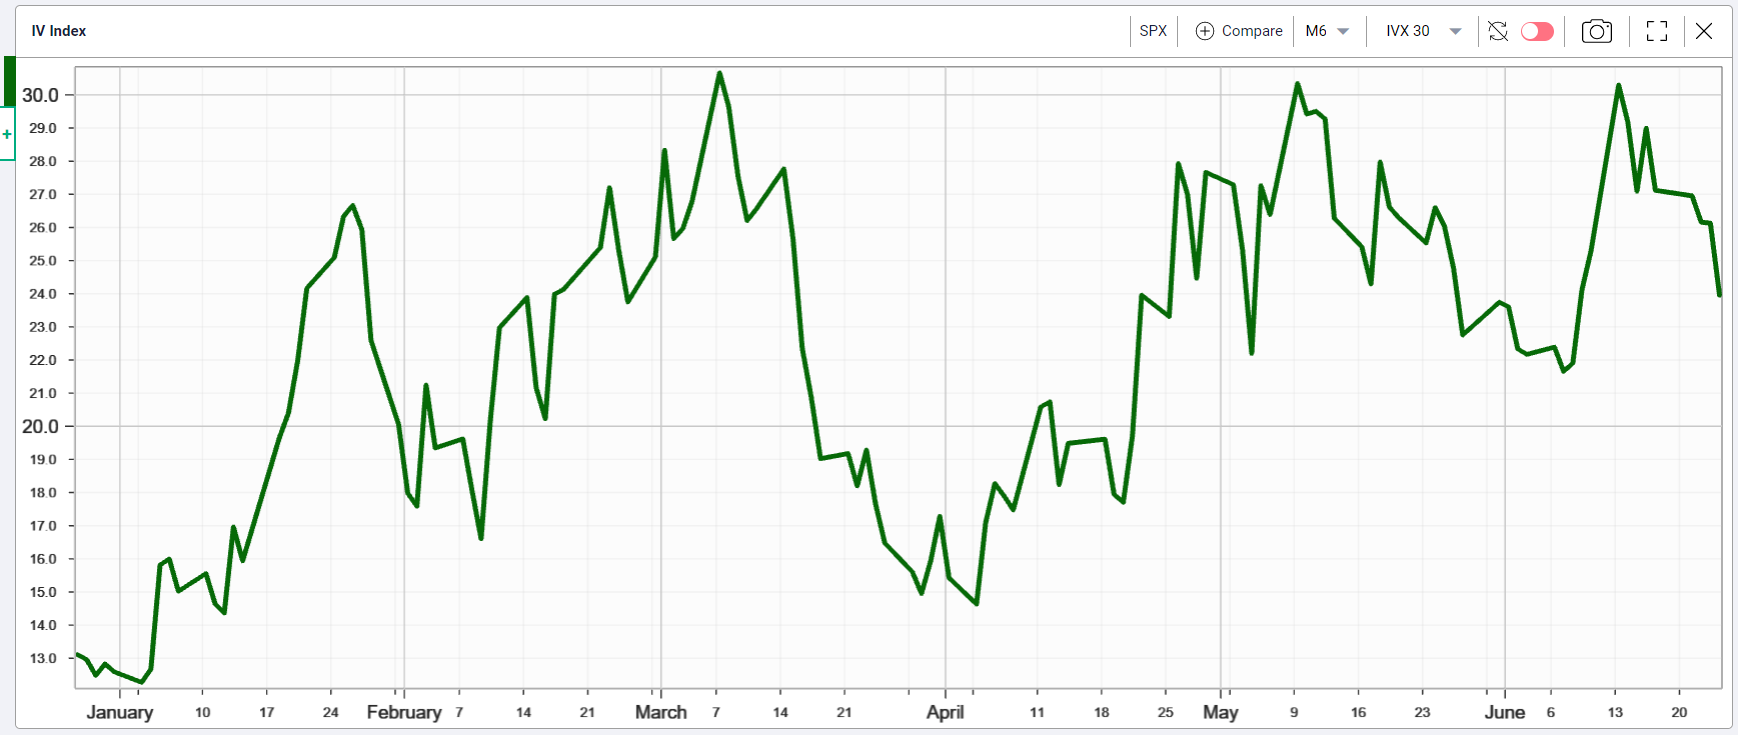
As for the SPX options market, implied volatility , IVX declined 3.17 or -11.69% Â last week ending at 23.95% , compared to 27.12% on June 17, shown below. As the bounce continues, it should decline back near 20%. |
|
Until interest rates show signs of peaking and earnings estimates begin reflecting a potential recession, the current advance seems like another bear market bounce with some specific defining objectives. |

