Market News & Research - WTI Crude Oil
August 8, 2022
In a decline since June 8, 2022, the time has come to look at crude oil. First, a brief update to last weeks' Head & Shoulders Bottom suggestion, with its upside objective at 4563.
S&P 500 Index (SPX) 4145.19 added 14.90 points or +.36% last week including a 6.75 point decline Friday after the surprising July non-farm payroll report that exceeded expectations by twice the estimate. After reaching 4167.66 on Wednesday it stalled on the way to reaching the June 2 milestone at 4177, the next challenge on the way to the upside objective. Since crude oil declined, the oil & gas stocks included in the SPX created some the drag.
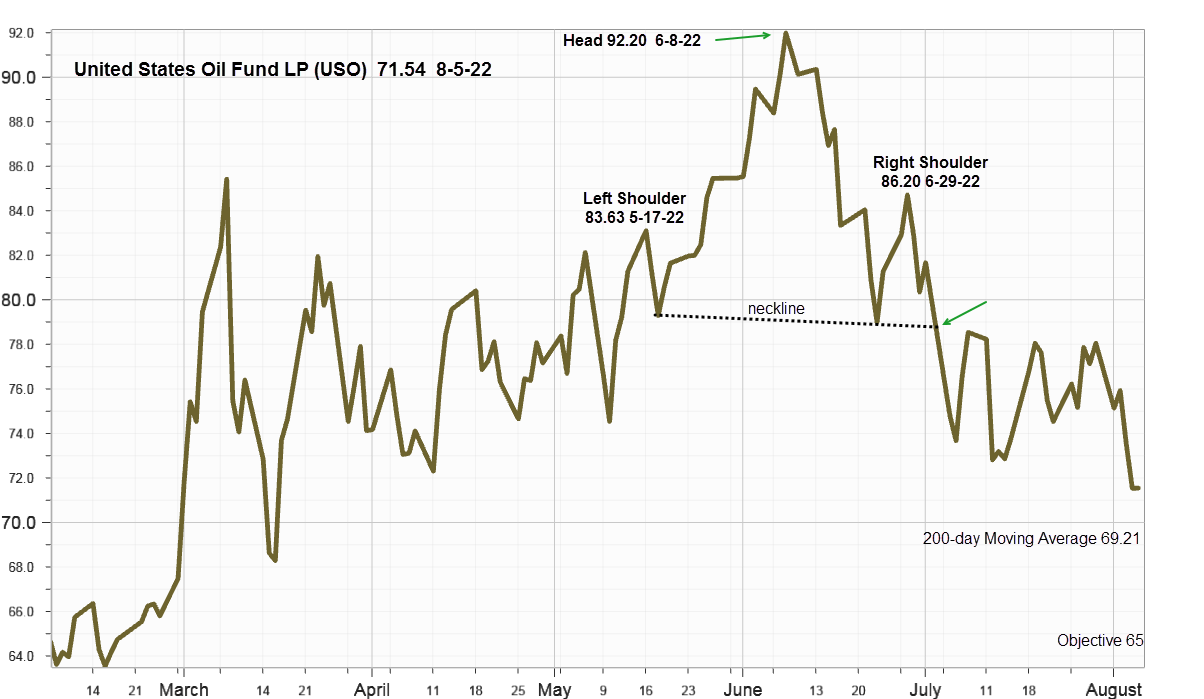
Untied States Oil Fund LP (USO) 71.54 slipped 6.51 points or -8.34% last week after activating a Head & Shoulder Top when it closed below the neckline on July 5 marked with a green arrow in the chart below.

The objective down at 65, determined by measuring the distance from the head to the neckline subtracted from breakdown shown in the right corner, would return it back to the level between 64 and 66 in early March. First it will need to close below the upward sloping 200-day Moving Average now at 69.21 providing a way measure any further weakness. Based on September futures at 89.01, look for a close below support at 86.
Implied Volatility
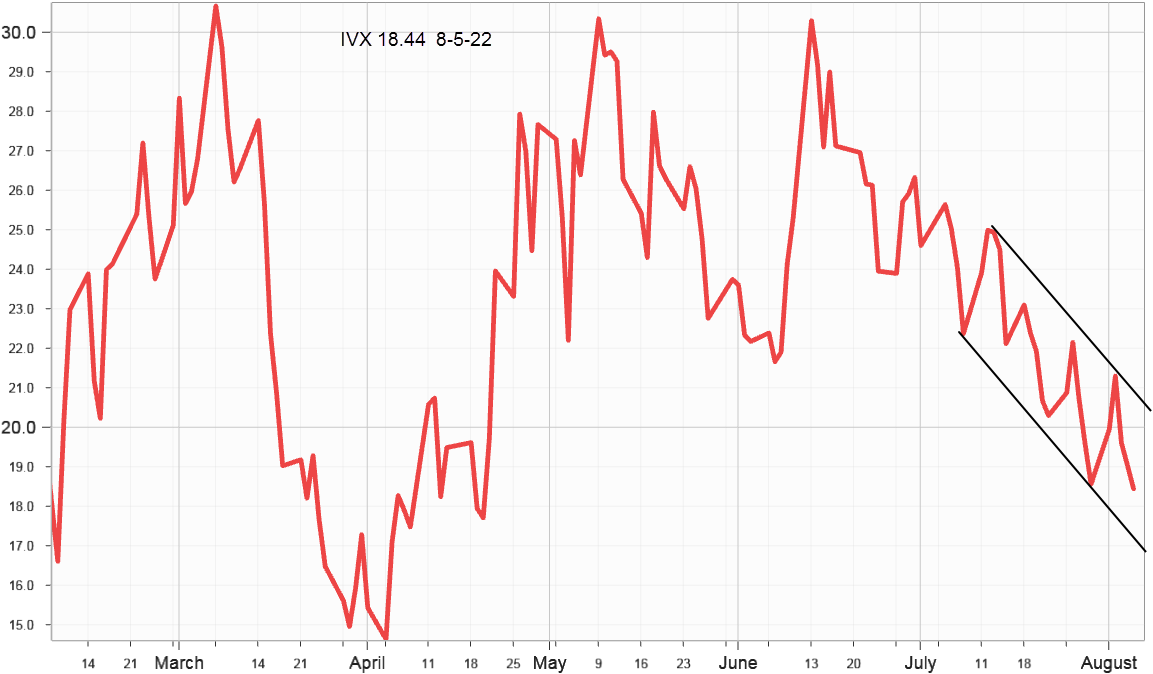
SPX options implied volatility index, IVX declined another .12% to 18.44% from 18.56% on July 29 supporting the rising SPX scenario and the Head & Shoulders Bottom upside objective. It's now in a well-defined downward sloping channel as it approaches the 15% -16% level.

Market Breadth as measured by our preferred gauge, the NYSE ratio adjusted Summation Index that considers the number of issues traded, and reported by McClellan Financial Publications gained 312.22 points last week to end at 468.70 and well above the slow turning 200-day Moving Average at -291.67. From the last Review on July 11, it added 857.20 points confirming the likelihood that the SPX will reach its upside objective at 4563, much to the delight of the bulls.
Summing Up
Some notable strategist and economists claim both fixed income and equities remain far ahead of macro fundamentals while interest rates continued rising as several regional Federal Reserve Bank officials dispelled the September pivot narrative that added to the divergence.
This comment attributed to Alan Greenspan, the long serving former Chairman of the Federal Reserve should help clear up the confusion. "I know you think you understand what you thought I said but I'm not sure you realize that what you heard is not what I meant."
The much stronger than expected non-farm payroll report on Friday caused hardly a noticeable ripple for the SPX held back by oil & gas stocks. Now the test comes as crude oil approaches the level from last March. In the meanwhile, both declining options implied volatility and expanding market breadth imply further gains in August.