Gold Uptrend
January 9, 2023
Before getting started on the gold story, consider: (1) a potentially important macro event occurred just before Christmas. On December 20, the Bank of Japan announced a decision to allow the 10-year bond yield to move 50 basis points in a wider band on either side of its 0% target. While denying it represents a change in policy, some carry traders may begin unwinding positions in anticipation of higher rates and a stronger yen. Since shorting yen provided global liquidity covering the shorts this means less liquidity as other currencies are sold. Stay tuned. (2) S&P 500 Index update.
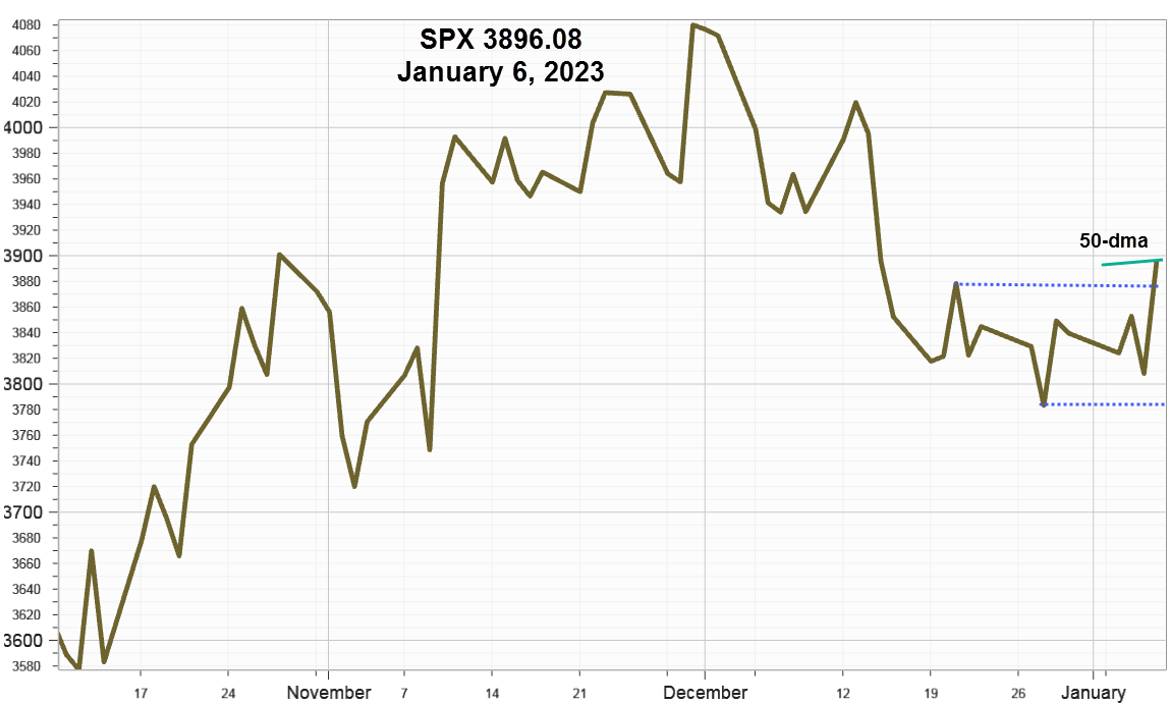
S&P 500 Index (SPX) 3896.08 advanced 55.58 points or 1.45% for the abbreviated first week of the year, with all the gain occurring on Friday, adding 2.28% as it broke out above a trading range that began on December 16 and ending just below the 50-day Moving Average at 3904.37. For the measuring objective of a range, add the vertical height to the highest level before breaking out. Friday’s breakout added 126 points to 3890 for an objective of 4016 - slightly above the 200-day Moving Average (now 3996), where it will encounter stiff resistance once again. The three-month line on close chart below shows the breakout of the range.
On a closing basis for 2022, it declined 19.4%, and even more using the intraday high and low. Bulls following the January barometer indicator will be encouraged by the first week's advance but need to see if it can close the month higher.

Gold
Now for a sector that belongs in the Woulda, Coulda, Shoulda, category. The quick advance after the November 8 mid-term elections could have been dismissed as just an emotional reaction. However, as it continued advancing after the S&P 500 Index recently failed at the 200-day Moving Average, this deserves the designation of "should have been" watching it closer.
The declining U.S. Dollar Index (DX) that made a decisive move lower on November 10th receives credit for much of the post mid-term gain, along with the market perception that interest rates are nearing a cyclical peak. In early December, BofA noted Central bank purchases rebounded in 2022 and could represent an early effort to reduce reliance on the U.S. Dollar.
With several alternatives available in the sector, two with substantial trading volume standout.
Barrack Gold Corp. (GOLD) $19.04, up 1.86 points or +10.83% for the week with 22 million shares traded Friday.
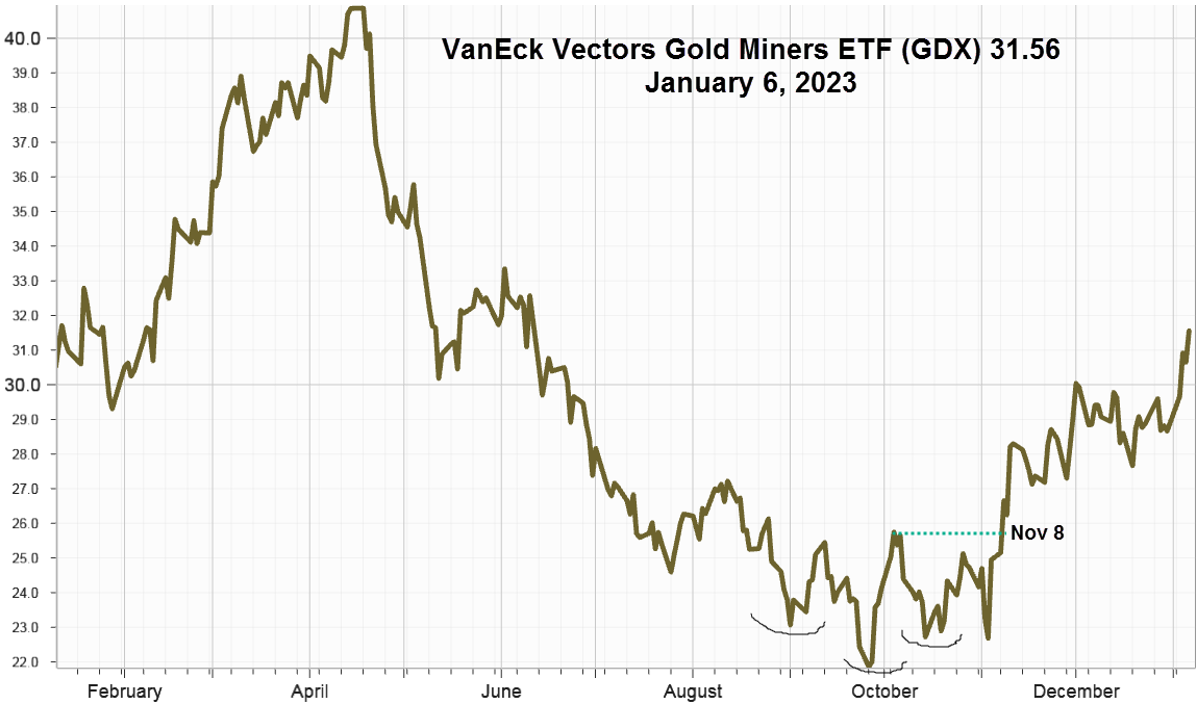
VanEck Vectors Gold Miners ETF (GDX) $31.56, up 12.90 points or +10.12% for the week with 32 million shares traded Friday. Chart:

From the April 18th intraday high of 40.91 to the September 26 intraday low, GDX declined 48% then began forming a Head & Shoulders Bottom pattern activated with the November 8 breakout.
As for options: 30-day Implied Volatility Index (IVX) at 38.24% with the 52-week range high of 49.35% on September 27th, and 28.42% low on January 7, 2022. Historical (Realized) Volatility at 39.45%, with a range high 56.25% on November 10th and a range low of 26.39% on January 6, 2022.
While the volatility measures are above the recent lows, both put and call implied volatility are almost the same.
Direction traders and hedgers may favor out-of-the-money call spreads or out-of -the money covered calls.
Summing Up
Friday's breakout above the recent range increases the odds that the S&P 500 Index will soon challenge the 200-day Moving Average once again, where it will likely encounter stiff resistance yet again.
Those not paying attention may have missed gold's outperformance relative to equities. Gold and the miners appear to have uptrends underway.
Oh, one last reminder: "There are old traders, and there are bold traders. But there are no old, bold traders.”
Previous issues are located under the News tab on our website. Before we go, see the message below from my colleagues at IVolLive...
IVolLive
Each week, we host a LIVE webinar on Tuesdays and Saturdays (excluding holidays). On the webinars, we cover how to use our proprietary IVolLive platform to navigate - and potentially profit from - the options market.
In Tuesday’s webinar, one of our experts walks viewers through how to navigate the powerful IVolLive platform including key tools, tabs, and shortcuts. The video also features specific examples using tech giants Micron and Intel. Watch the video HERE.
Then, on Saturday, we covered important features and chart layouts. We also covered futures and how to run various screeners on this important asset class. You can watch the video HERE.
Finally, to register for an upcoming webinar, click HERE.