Earnings Challenge
January 17, 2023
This week and for a few more, the markets will focus on earnings reporting for Q4. For the last two weeks the financial media widely disseminated notes from banks and brokers that earnings estimates exceeded reality since reduced estimates are easier to beat. Apparently, Wall Street analysts seem less concerned if the report and forward guidance comes in good or bad, only concerned if the results equal, are better than, or fall below analyst consensus forecasts.
The latest wrinkle to the earnings game comes from AI and algos programmed to trade based upon comparing reported headline earnings and forward guidance to reduced forecasts. Something - if better than or less than buy or sell automatically. This knee-jerk earnings trading continues despite prices often reversing later in the day after more details and nuanced data are added into the equation. For those brave enough to face up to it, the game begins this week. First, a brief look at last week's progress.
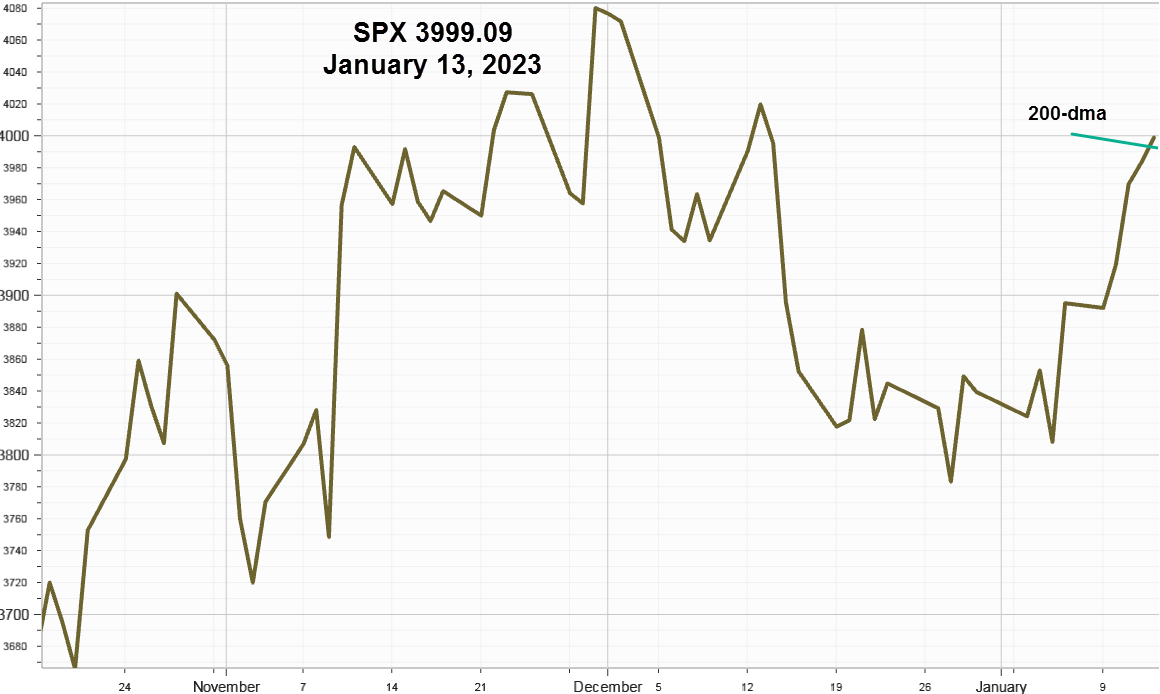
S&P 500 Index (SPX) 3999.09 bounced up 104.01 points or 2.67% and closed Friday above the 200-day Moving Average at 3981.22 on moderate combined volume of 2.3 billion shares. Since the high last January, this makes the fifth attempt to make sustainable closes above this resistance. It's like a weed trying to break through the pavement into the sunlight, can it continue higher or will it once again meet the wrath of the weed whacker. Earnings could decide. The line on close chart:

Implied Volatility
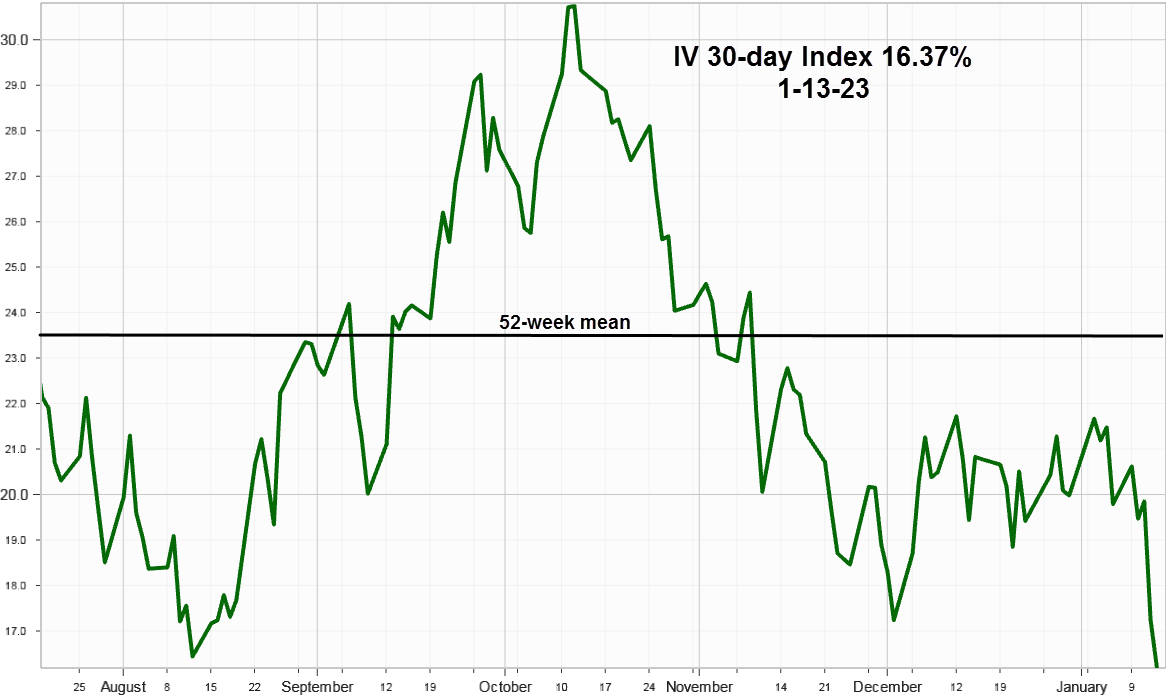
SPX 30-day options implied volatility index, IVX declined 17.66% last week to end at 16.37% after dropping off a cliff on Thursday's Consumer Price Index report proclaimed in-line with expectations. It's now approaching the 52- week low at 15.51% made last January 20 and since it eventually reverts to the mean watch 23.69% the 52-week mean and a slightly higher 24.52% from June 5, 2020. At the end of last week, implied volatility enthusiastically supported the breakout view.

Market Breadth
Market breadth update supports the breakout view.
Market Breadth as measured by our preferred gauge, the NYSE ratio adjusted Summation Index that considers the number of issues traded, and reported by McClellan Financial Publications advanced every day last week adding 413.74 points to finish 384.78 and slightly above the previous December 5 pivot high at 333.38. Continuing breadth improvement increases the odds it can continue higher as it did in early December just before turning lower. Expect a repeat performance if the SPX fails to push higher.
Trader's Reminder
If you can't define your edge, you don't have one. From the archives, some edge thoughts.
Summing Up
As earnings reporting gets underway this week, keep in mind lowered estimates help companies beat the numbers, but those that fail will likely see their stock prices decline unless offset by positive credible forward guidance. Odds for price reversals increase when after large price advances or declines going into the report.
After last Thursday's CPI report the markets ended the week on a positive note with the S&P 500 Index overcoming resistance at the 200-day Moving Average, with options implied volatility dropping suddenly and with market breath expanding once again like driving with the top down on a clear warm day.
Previous issues are located under the News tab on our website.
IVolLive
Each week, we host a LIVE webinar on Tuesdays and Saturdays (excluding holidays). On the webinars, we cover how to use our proprietary IVolLive platform to navigate - and potentially profit from - the options market.
In Tuesday’s webinar, one of our experts walks viewers through how to navigate the powerful IVolLive platform including key tools, tabs, and shortcuts. The video also features specific examples using tech giants Micron and Intel. Watch the video HERE.
Then, on Saturday, we covered important features and chart layouts. We also covered futures and how to run various screeners on this important asset class. You can watch the video HERE.
Finally, to register for an upcoming webinar, click HERE.