Analysis of options using volatility and other parameters
Volatility coefficient (IV Index/HV)
Stocks with higher historical volatility will command higher option premiums because their chances of moving beyond the strike prices by expiration are greater. So Implied Volatility, and therefore the Implied Volatility Index, that is implicit in the option prices observed on the market will higher as well.
Historical volatility reflects the past price movements of the underlying asset, while the implied volatility index, as well as implied volatility, represent the market's expectations of a stock's future price movement. The ratio of n-day IV Index to n-day HV shows whether the current forecast volatility value over the next n days is greater or less than the historical volatility over the past n days. Typically, historical volatility of a stock or index is not equal to its implied volatility. The ratio of IV Index to Historical Volatility we will call the volatility coefficient.
Comparing historical and implied data allows one to estimate the current market situation, to find a period of time when options are too overpriced (so it is profitable to sell them) or too conservatively priced (so it is profitable to buy them), to find extremes, select a pertinent trading strategy, and engage in sentiment analysis.
Example
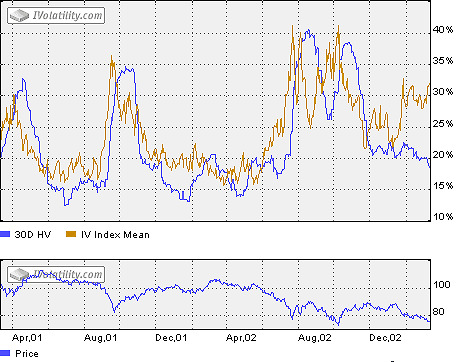
Let's look at the chart below which shows the 30-day implied volatility index and historical volatility for DJX. What can this chart reveall about market? At first, since the 30-day implied volatility index is a 30-day forecast of how an underlying asset will fluctuate in the future, the 30-day implied volatility moves ahead of historical volatility. As you can see the implied volatility index has high predictive ability. And its jumps and drops give sharp estimations of future volatility. The jumps or drops of the implied volatility index are caused by jumps or drops of an index value. Over last two years, implied volatility was higher than historical volatility, suggesting relatively high option volatility and high option premiums. The current value of implied volatility (32%) is high relative to the historical volatility (19%). It means that currently index options are relatively rich and it is profitable to sell them.
