Implied Volatility Index (IV Index)
The Implied Volatility of a stock or index is Volatility implied by an option price observed in the market. Because there are many options on a stock with different strike prices and expiration dates, each option can yield a different volatility implicit in an option's premium. Even options with the same number of days remaining until expiration, but with different strike prices, will have different values of implied volatility. Thus to use implied volatility in volatility analysis, it is necessary to calculate a representative implied volatility for a stock. There are many ways to calculate such a type of representative value. It can be calculated as average implied volatility of the at-the-money options only or at-the-money and out-the-money options etc.
We calculate such a composite Volatility for a stock by taking suitable weighted individual option volatilities. This composite volatility will be referred to as the Implied Volatility Index.
The Implied Volatility Index is calculated by using a proprietary weighting technique factoring the delta and vega of each option participating in IV Index calculations. In total, we use 4 ATM options within each expiration to solve for the Implied Volatility Index of each stock. This IV Index is normalized to fixed tenors (30, 60, 90, 120, 150, 180 days) using a linear interpolation by the squared root of time.
IVIndexCall and IVIndexPut are the implied volatility indexes calculated for only calls or puts. IVIndexMean is calculated as an average between IVIndexCall and IVIndexPut. IVIndexMean is nothing other than the Implied Volatility Index.
The annualized IVIndex 30 d of 25% implies that the average of daily Volatilities for the nearest 30 calendar days is expected
to be \( \frac{25}{\sqrt{252}} \) or 1.57 %.
For more information about annualized volatility, see Introduction to Volatility.
All else being equal, the more violent and rapidly moving the market (i.e. the higher implied volatility), the more expensive the option contracts. If one stock has IV Index of 25% and another 50%, it can be definitively be said that options of the second stock are more expensive than those of the first stock.
Example
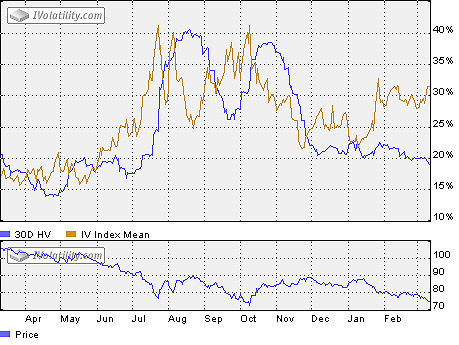
The following chart shows the 30d implied volatility index and historical volatility for DJX. The 30 day implied volatility index shows what volatility is expected to be in the ensuing 30 days. As you can see on the chart it provides a sufficiently accurate forecast, and all drops and jumps in IV Index correspond to drops and jumps of actual volatility that occurred in the next 30 days. For example, the jump of IV index in July corresponds to a jump of historical volatility in August. As mentioned above implied volatility, and, therefore, the implied volatility index, tells whether the options on a stock are relatively cheap or expensive. Thus jumps in the IV Index of DJX in July and October suggest expansive options on the DJX.
