Volatility Surface
If one wants to analyze the behavior of any parameter he observes historical data- for example, a stock price chart demonstrates clearly how the stock's price changed during some period of time. Further technical analysis can be applied to these price values to make decisions about market trend, best times for buying or selling etc. But this can't be applied to the option price directly.
If you want to estimate whether the option is expensive or cheap now, it does not make sense to compare its current price with the price of the same option in the past, because the time factor critically affects the option's price. Also, as the option price is dependant on many factors like spot, time, etc. - it can't be considered as an indicator of market trends, while Volatility can. But when using volatility for this purpose we should be careful. In the instances above we used historical charts of the IVIndex or different historical volatilities we always mentioned one TERM which was used every day to estimate the volatility in the past. The same rule is applicable to implied volatilities derived from the option prices - we can compare volatilities if the term (or days to expiration) is the same. Thus, simply drawing the historical IV chart of an option can be useful but it can't answer the question- whether today's option is cheap or expensive?
The solution is simple- we can find a virtual option within our history which has the same parameters term (Maturity) and Moneyness as the current option. The Volatility Surface enables us to realize this.
The Volatility Surface allows one to execute historical analysis of implied volatility (thus option price level), i.e. to compare the current option price with the price of the option with the same moneyness and days remaining until expiration, which was observed on the market some time ago.
The Volatility Surface is a 4 dimensional surface defined by Implied Volatility, Moneyness(Strike), Maturity(Expiration) and Time. Each day (Time axis) a 3-dimentional surface is calculated on the basis of current IV and points with moneyness and maturity using a linear interpolation and stored in the IVolatility.com database. Daily IV Surface consists from 96 points: 12 points by % moneyness and 8 point by maturity (30, 60, 120, 150, 180, 360, and 720). In total 96 points. The Volatility value is calculated for each point.
The IV Surface can be used to receive different sections (by one or two variables), which can be used to estimate volatility time and strike skews, the dynamics of volatility changes for an option, and to realize different kinds of analysis.
The Historical IV chart by fixed moneyness (strike) and fixed time to maturity (expiration) can be drawn using surface data and it shows how the implied volatility of an option (with this strike and days to expiration) changed over time. Actually such a chart shows the history of implied volatility of some virtual option, which has the same parameters of moneyness and days to expiration as today's actual option.
Another advantage in the practical usage of the surface is that the trader doesn't have to worry about corporate actions and strikes adjustments. If a stock had some adjustments (splits, stock dividends, etc) then its historical prices and strikes of its options have to be changed accordingly for historical analysis; So it can be difficult to identify whether the current option's parameters are high or low in relation to their historical values. The use of the IVolatility surface built and stored in the IVolatility.com database solves this problem because the surface is based on moneyness and is not dependent on strike adjustments.

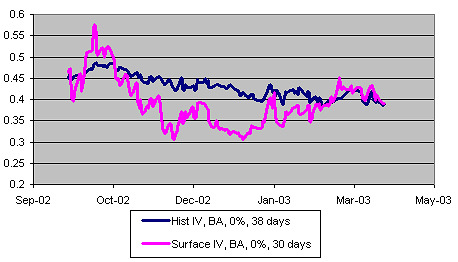
Below is an example of an actual current option's historical implied volatility on stock BA, May expiration (38 days to expiration), strike $27.5 with spot $27.5 and the volatility chart is taken from surface of options with similar parameters (30 days to expiration, 0% moneyness). It is clearly seen how differently they have behaved in history. While historical IV was quite plain with a decreasing trend, the IV from surface has local spikes. While the current value is at its lowest level in the historical IV chart, the Surface chart shows that it is at about average.
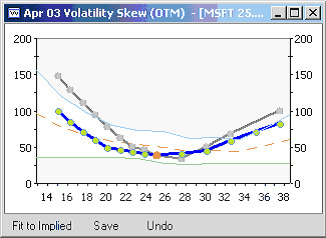
To expand this idea we calculate Volatility Bands. For each of 96 points (moneyness, maturity) in the surface we calculate minimum and maximum values reached for the last year (time axis). Then adjust to today's options moneyness and maturity and this allows traders to use these bands as a corridor of volatility. Knowing the mean reversion rule we can monitor how far from the average value volatility curves are and make decisions about its future movements. If curves are approaching the bands this as well indicates what options (OTM, ITM, ATM) are more over or under priced.
The picture below shows example of this.

The dashed line indicates the average value of volatility, blue- the high level, green- the low level. The grey line is the current market skew. As it can be seen the ATM options are below their mean, while the far from current spot options are above the highest level. This means that OTM calls and puts today reached new maximum values and are the most expensive at this point as recorded, while ATM options are quite cheap.
The volatility surface data are widely used in the construction of options strategies as it allows traders to find expensive and cheap options today within any one expiration or within different expirations. Traders can then accordingly create any kind of spreads and combinations with the desired parameters.