MBS Bonds: TBA Coupon Stack Valuation & Risk - Prepayment Model vs. Data
May 5, 2025
Conventional and GN TBA WTD pools are the most liquid mortgage securities. Although prepayment models are generally more accurate for these securities than for less liquid or off-the-run collateral, they still do not always consistently provide accurate valuations or risk - either across different models or in comparison to actual data. There are several reasons for this:
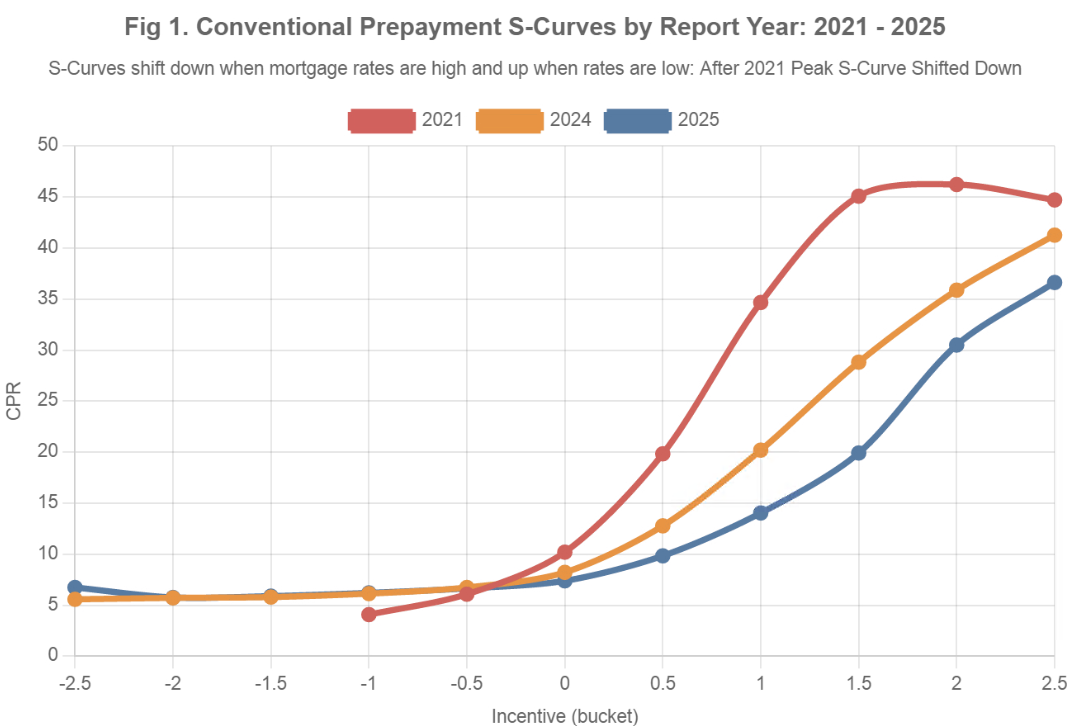
- Calibration Lag & S-Curve Shifts: S-curve shifts (see Fig. 1 below) over time and vary by collateral type and mortgage rate environment. Different prepayment models are calibrated at different points in time, typically with a 3-6 month lag.
- Degrees of Freedom: Mortgage collateral is highly diverse and constantly evolving. The $13 trillion MBS market consists of a wide range of mortgage loans with varying characteristics that perform differently under different conditions. Market events (e.g., Rocket's recent acquisition of Mr. Cooper), regulatory changes (such as updates to VA/FHA mitigation options), and technological advances in refinancing all influence prepayment speeds. No model offers sufficient flexibility – or degrees of freedom – to fully capture all of these features and dynamics.
- Black Box Complexity: Due to their inherent complexity, prepayment models often lack transparency and become difficult to interpret or validate.
Most mortgage professionals address these limitations by supplementing model outputs with data-driven analysis. However, this process is typically manual, time-consuming, subjective (based on an analyst's judgment), and inconsistent – even though most trading desks follow a similar approach.
We have automated this process to make it consistent, scalable, and easy to use.
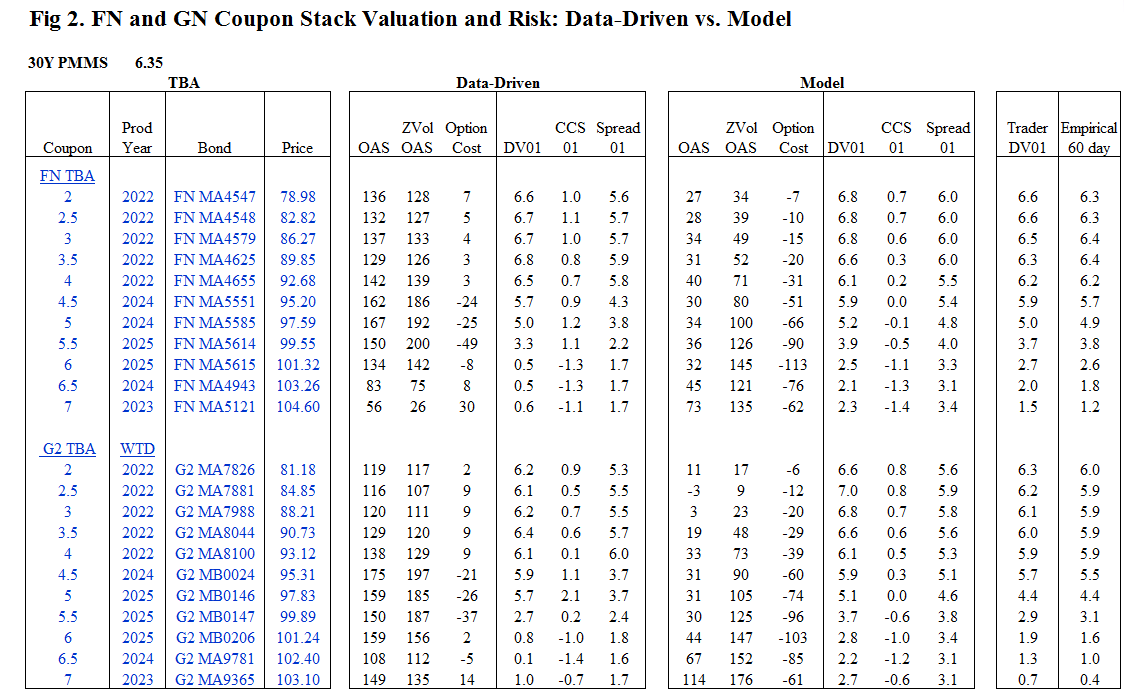
Below, we examine the FN and GN coupon stacks TBA WTD pools and compare the results to one of the most widely used prepayment models with our No-Model Data-Driven approach – which relies directly on historical performance data without applying subjective modeling assumptions:
- Spread (ZVol OAS), Spread DV01 (OAS01)
ZVol OAS effectively reflects the implied effective CPR used by these approaches in base-case scenarios. We observe the following:
– Discount Bonds:
Data shows faster discount speeds than those used by models.
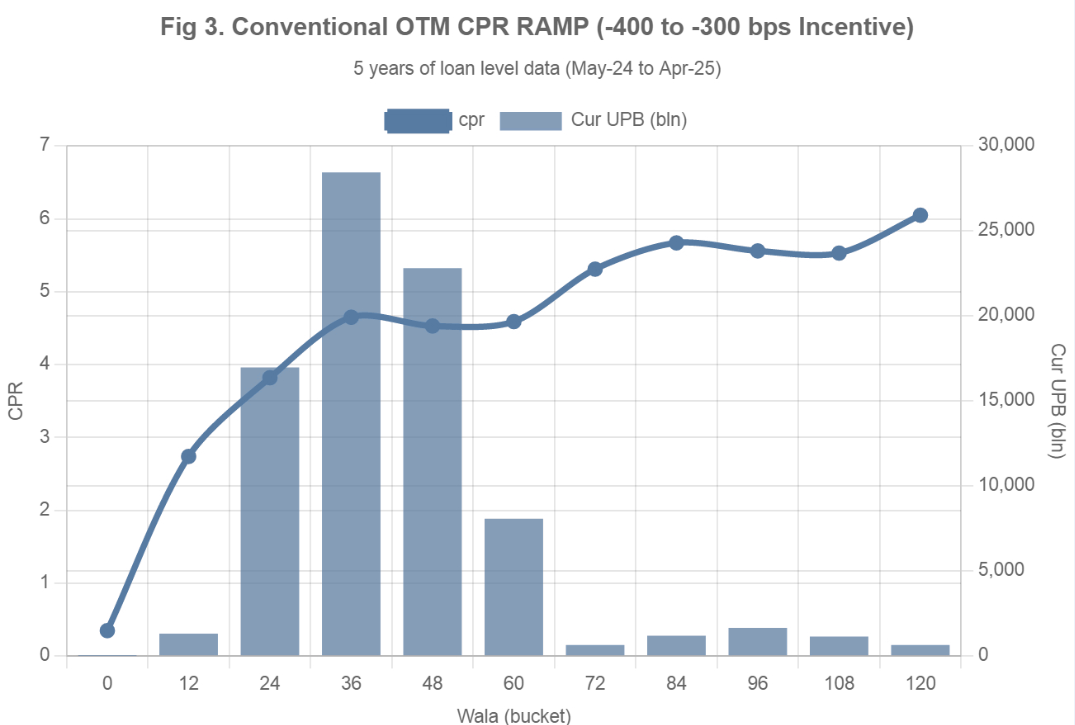
We use FN MA4547 (FN 2 Multi 2021) as an example. The difference between the models is significant: 34 bps vs. 128 bps ZVol OAS (e.g. it is about 2CPR difference for FN 2s). The data-driven approach results in a cheaper ZVol OAS and runs the bond at faster speeds. If we analyze loan-level prepayment data (see Fig. 3), using 5 years of data or even shorter periods, the results align closely with the data-driven approach. This can be validated by calculating the spread to the swap curve (e.g., R spread) at 5 CPR on any MBS pricing screen.
See more details HERE:
– Premium Bonds:
Data shows tighter ZVol OAS and faster speeds on ITM coupons (e.g., 6.5s and 7s), which can also be verified by running historical speeds on any MBS pricing screen. - OAS, Option Cost, Convexity
OAS reflects both the spread (ZVol OAS) and the cost of hedging the MBS security (Option cost):
OAS = ZVol OAS + Option Cost
– Deep Discount Bonds:
In the models, option cost is negative. However, when using data with reasonable yield curve shifts, option cost is marginally positive. If rates sell off, CPRs typically remain unchanged – but if rates rally, CPRs increase, which benefits discount bonds.
– Premium Bonds:
Since these bonds already prepay near peak speeds, there is greater upside potential if rates sell off (due to slowing speeds) than downside risk if rates rally. As a result, the data approach reflects better convexity for premium bonds than the models suggest.
Option Cost calculations can be manually validated as described HERE: - DV01, CCS01
Current Coupon Spread 01 (CCS01) reflects the change in an MBS security's price when the mortgage spread (over swaps) narrows. This sensitivity is similar to the shape of the S-curve. DV01 measures the price sensitivity of an MBS to changes in interest rates, accounting for both discounting and changes in mortgage rates.
DV01 = OAS01 + CCS01
Figure 2 below shows four types of DV01:
Data – calculated using a no-model, data-driven methodology
Model – calculated using a prepayment model
Trader – consensus TBA DV01 across trading desks
Empirical – calculated using econometric analysis of TBA prices over the last 60 trading days
Key observations comparing data and model DV01s:
– For 2 to 5.5 coupons, DV01s are very similar for all calculation methods
– For higher coupons (6 to 7), the model DV01 is closer to trader, while the data aligns more closely with the empirical DV01—especially for Ginnie Mae securities. - Summary of Relative Value: Data vs. Prepayment Model
– Lower Coupons (e.g., 2s to 5s):
Data shows these pay a few CPR faster than modeled, making them cheaper with better convexity.
– Higher Coupons (e.g., 6s and 7s):
Data indicates materially faster prepayment speeds than by a model, making these bonds richer.
– DV01 Comparison:
For 2 to 5.5 coupons, DV01s are similar across all four approaches (Data, Model, Trader, Empirical).
For 6 to 7 coupons, the data DV01s align more closely with empirical estimates, while model DV01s are closer to trader consensus.
What is the best solution to reconcile models and data?
We believe in complementing models results with data analysis – without model complexity and subjective modeler assumptions. But the biggest challenge is that in most cases, this process is manual, very time-consuming, subjective (based on an analyst's opinion), and inconsistent – even though all trading desks perform similar manual processes.
We automated this process and made it easy to use. It is different from a prepayment model in the following ways:
- Comprehensive – covers all types of collateral as long as there is historical performance data available
- Transparent – all results can be validated against historical data
- Objective – not based on modelers' subjective assumptions
- Timely – updates as soon as a new monthly prepayment report is released
This No-Model Data-Driven Valuation Technology automates this process across all structured products, delivering the most accurate and consistent pricing and risk metrics.
Why Choose Us?
With over 20 years of experience and a proven track record in data and analytics development, IVolatility serves more than 500 institutional clients and 130,000 retail customers. Now, we're bringing this expertise to MBS data and analytics.
Discover the benefits of using IVolatility solutions for Mortgages:
Got a question or a comment?
We're here to serve IVolatility users and we welcome your questions or feedback about the MBS data insights discussed in this post. If there is something you would like us to address, we're always open to your suggestions. Please let us know!
Previous issues are located under the News tab on our website.